- Products
- Learn
- Local User Groups
- Partners
- More
Introduction to Lakera:
Securing the AI Frontier!
Quantum Spark Management Unleashed!
Check Point Named Leader
2025 Gartner® Magic Quadrant™ for Hybrid Mesh Firewall
HTTPS Inspection
Help us to understand your needs better
CheckMates Go:
SharePoint CVEs and More!
I'm trying to find a good report/view/chart to graph top bandwidth utilization applications over time. I can find this view but it's only cumulative for the specified time period, not graphed over time. So rather than just a list of the top applications and their total usage over, for example, 30 days, I need to see a graph of the traffic. For example we have an application that uses a ton of bandwidth, but it should ONLY be doing so after hours. The High Bandwidth Applications view doesn't reveal the bandwidth usage patterns...
You wanting to see that, at hour X that application Y is using Z bytes of data, is that correct?
https://community.checkpoint.com/people/dados1c5b14ae-3a0e-30b3-8774-7305f45a41dc?
That's exactly what I'm looking for, a historical graph of data usage per application over a a designated time period, rather than just the total usage by that application over a designated time period.
Something like this?
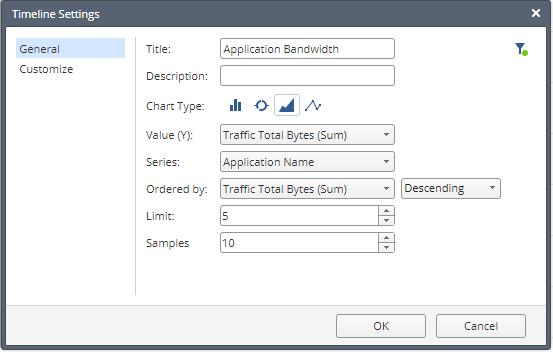
Create a time line widget and use the below settings:
To get more applications, increase the limit parameter.
Do you use SmartEvent for this? Is this also possible with R77.30?
This is SmartEvent R80.10.
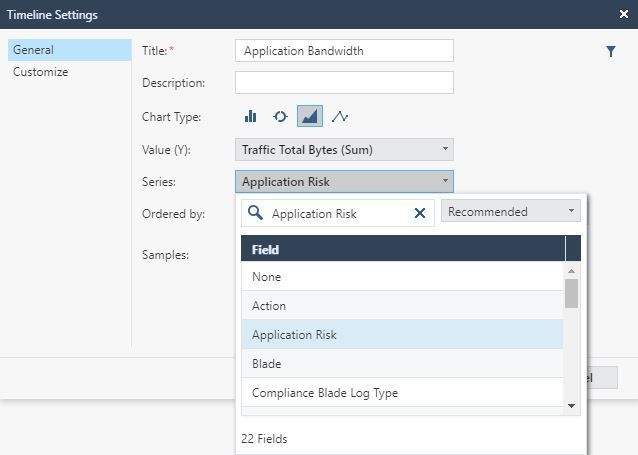
I don't appear to have 'Application Name' available as the Series:
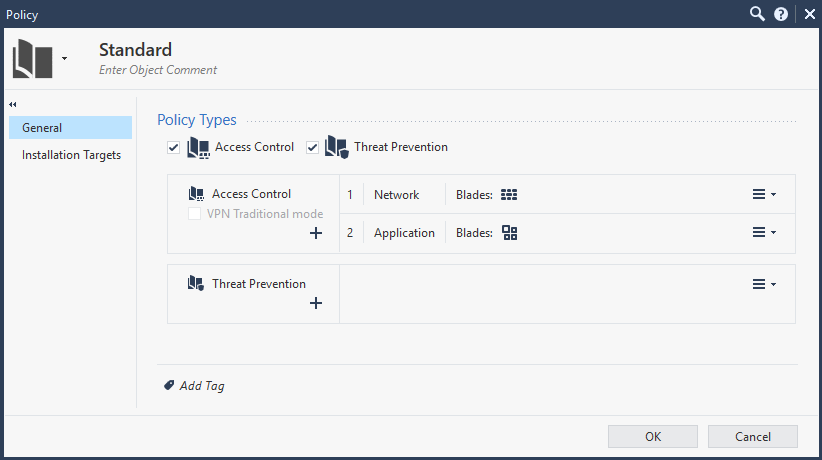
We have two access policies where all rules are set to 'Log' in the 'Network' policy and all rules are set to 'Extended Logging' in the 'Application' policy:
Logs record Application Names:
This is on a MDS R80.30, recently upgraded from R80.10 and a newly deployed R80.30 non-MDS installation.
I'm trying to do this just to have a view of the internet data per day. The results are not correct. Does this require accounting to be active on the logging of the rules?
The clients would like a report of bandwith usage per day per gateway.
Even with the recent change in secureXL?
Hi guys,
This is useful info as we have a client that wants to find out about their bandwidth usage before/during this whole COVID crisis.
I was able to create the widget but the query seems to fail, and say it has no data (see screenshot). Am I doing something wrong with how I am logging or missing something? I am trying to create this custom report to be relevant in network Bandwidth usage, not just application bandwidth usage.
Wanted to see if other people are having this same issue.
Let me know. Thanks
-C
Change the "Ordered by" field from "Total Bytes (Sum)" to "Traffic Total Bytes (Sum)".
Leaderboard
Epsum factorial non deposit quid pro quo hic escorol.
User | Count |
---|---|
24 | |
16 | |
4 | |
3 | |
3 | |
3 | |
3 | |
3 | |
2 | |
2 |
Tue 30 Sep 2025 @ 08:00 AM (EDT)
Tips and Tricks 2025 #13: Strategic Cyber Assessments: How to Strengthen Your Security PostureTue 07 Oct 2025 @ 10:00 AM (CEST)
Cloud Architect Series: AI-Powered API Security with CloudGuard WAFTue 30 Sep 2025 @ 08:00 AM (EDT)
Tips and Tricks 2025 #13: Strategic Cyber Assessments: How to Strengthen Your Security PostureThu 09 Oct 2025 @ 10:00 AM (CEST)
CheckMates Live BeLux: Discover How to Stop Data Leaks in GenAI Tools: Live Demo You Can’t Miss!Wed 22 Oct 2025 @ 11:00 AM (EDT)
Firewall Uptime, Reimagined: How AIOps Simplifies Operations and Prevents OutagesAbout CheckMates
Learn Check Point
Advanced Learning
YOU DESERVE THE BEST SECURITY