- Products
- Learn
- Local User Groups
- Partners
- More
This website uses Cookies. Click Accept to agree to our website's cookie use as described in our Privacy Policy. Click Preferences to customize your cookie settings.
- Products
- Learn
- Local User Groups
- Upcoming Events
- Americas
- EMEA
- Czech Republic and Slovakia
- Denmark
- Netherlands
- Germany
- Sweden
- United Kingdom and Ireland
- France
- Spain
- Norway
- Ukraine
- Baltics and Finland
- Greece
- Portugal
- Austria
- Kazakhstan and CIS
- Switzerland
- Romania
- Turkey
- Belarus
- Belgium & Luxembourg
- Russia
- Poland
- Georgia
- DACH - Germany, Austria and Switzerland
- Iberia
- Africa
- Adriatics Region
- Eastern Africa
- Israel
- Nordics
- Middle East and Africa
- Balkans
- Italy
- Bulgaria
- Cyprus
- APAC
- Partners
- More
- ABOUT CHECKMATES & FAQ
- Sign In
- Leaderboard
- Events
Call For Papers
Your Expertise, Our Stage
Ink Dragon: A Major Nation-State Campaign
Watch HereAI Security Masters E5:
Powering Prevention: The AI Driving Check Point’s ThreatCloud
The Great Exposure Reset
AI Security Masters E4:
Introducing Cyata, Securing the Agentic AI Era
CheckMates Go:
CheckMates Fest
Turn on suggestions
Auto-suggest helps you quickly narrow down your search results by suggesting possible matches as you type.
Showing results for
- CheckMates
- :
- Products
- :
- Hybrid Mesh
- :
- Firewall and Security Management
- :
- Policy install duration
Options
- Subscribe to RSS Feed
- Mark Topic as New
- Mark Topic as Read
- Float this Topic for Current User
- Bookmark
- Subscribe
- Mute
- Printer Friendly Page
Turn on suggestions
Auto-suggest helps you quickly narrow down your search results by suggesting possible matches as you type.
Showing results for
Are you a member of CheckMates?
×
Sign in with your Check Point UserCenter/PartnerMap account to access more great content and get a chance to win some Apple AirPods! If you don't have an account, create one now for free!
- Mark as New
- Bookmark
- Subscribe
- Mute
- Subscribe to RSS Feed
- Permalink
- Report Inappropriate Content
Jump to solution
Policy install duration
Hi all,
How do you check the policy installation duration?
Regards,
Simon
1 Solution
Accepted Solutions
- Mark as New
- Bookmark
- Subscribe
- Mute
- Subscribe to RSS Feed
- Permalink
- Report Inappropriate Content
On an R80+ SMS all policy install events are logged to a special file $FWDIR/log/install_policy.elg with timestamps. In particular try seeking out **##PERF_MSG_IDENTIFY##** records in that file, as they appear to have the duration information you need, but it is not exactly easy reading:
**##PERF_MSG_IDENTIFY##** {"duration_data":[{"duration":0.4473197529999826,"name":"duration_of_code_generation#A-GW-Cluster"},{"duration":4.560813636999992,"name":"duration_of_policy_commit#A-GW-Cluster"},{"duration":0.9066284540000029,"name":"duration_of_policy_compilation#A-GW-Cluster"},{"duration":0.7535922519999899,"name":"duration_of_policy_transfer#A-GW-Cluster"}]}&CURRENTVERCMP
New Book: "Max Power 2026" Coming Soon
Check Point Firewall Performance Optimization
Check Point Firewall Performance Optimization
18 Replies
- Mark as New
- Bookmark
- Subscribe
- Mute
- Subscribe to RSS Feed
- Permalink
- Report Inappropriate Content
You mean how long the policy install is taking?
I don’t believe we instrument it, or if we do, we don’t expose that anywhere.
- Mark as New
- Bookmark
- Subscribe
- Mute
- Subscribe to RSS Feed
- Permalink
- Report Inappropriate Content
In the bottom left hand corner of SmartConsole you have the "Tasks" section to view progress/status etc
The "Details" option should provide you more info including the Start & Completion Time.
CCSM R77/R80/ELITE
- Mark as New
- Bookmark
- Subscribe
- Mute
- Subscribe to RSS Feed
- Permalink
- Report Inappropriate Content
Hi @Chris_Atkinson it would be helpful if the granularity of the times displayed at the start and end of a policy installation in the Tasks area of SmartConsole could be increased to show not just the hour and minute but also seconds as well. Thanks!
New Book: "Max Power 2026" Coming Soon
Check Point Firewall Performance Optimization
Check Point Firewall Performance Optimization
- Mark as New
- Bookmark
- Subscribe
- Mute
- Subscribe to RSS Feed
- Permalink
- Report Inappropriate Content
The use case might be diminished now with accelerated policy install in R81 (sk169096) but thanks for the feedback I'll pass it along.
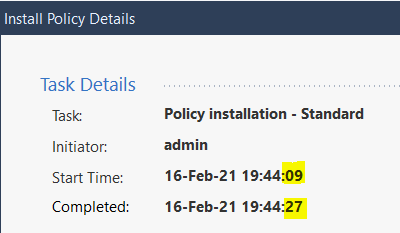
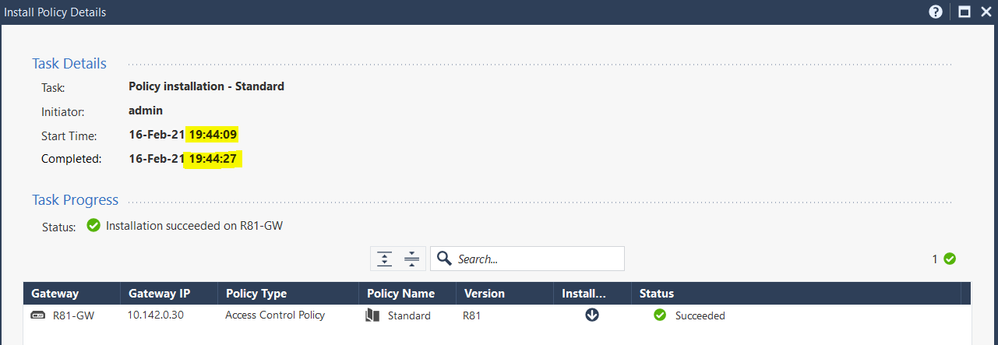
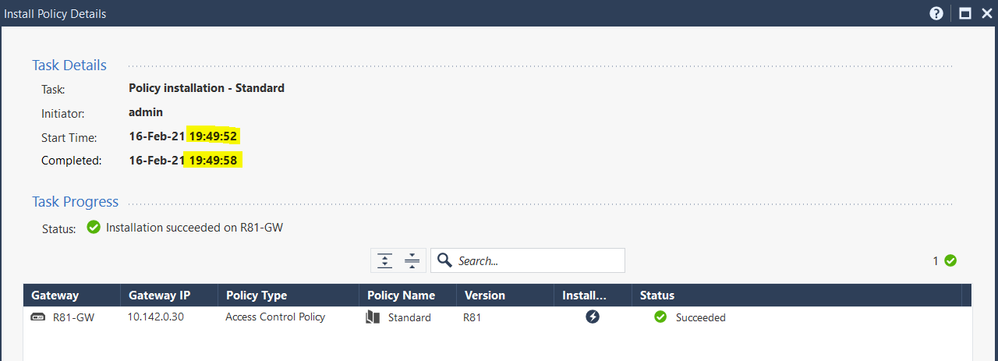
/Edit: Now available with R81 SmartConsole Build 549 and above:
CCSM R77/R80/ELITE
- Mark as New
- Bookmark
- Subscribe
- Mute
- Subscribe to RSS Feed
- Permalink
- Report Inappropriate Content
I am pretty positive that sk is 99% wrong...I seen it before and tested in R81 lab and literally none of those things apply. Not sure who from Check Point came up with that list, but I would be curious to know exactly what type of testing they did : )
Best,
Andy
"Have a great day and if its not, change it"
Andy
"Have a great day and if its not, change it"
- Mark as New
- Bookmark
- Subscribe
- Mute
- Subscribe to RSS Feed
- Permalink
- Report Inappropriate Content
Requires management & gateway to be R81, was that the case in your lab?
CCSM R77/R80/ELITE
- Mark as New
- Bookmark
- Subscribe
- Mute
- Subscribe to RSS Feed
- Permalink
- Report Inappropriate Content
Exactly that! And I know you guys like to always ask people to install latest jumbo, so I did...jumbo 13. Makes no difference. Try it yourself and you will see.
Best,
Andy
"Have a great day and if its not, change it"
Andy
"Have a great day and if its not, change it"
- Mark as New
- Bookmark
- Subscribe
- Mute
- Subscribe to RSS Feed
- Permalink
- Report Inappropriate Content
What was the specific symptom, the policy failed to install or just took longer than you expected to complete?
Perhaps some testing with and without it disabled (sk168055) is needed to quantify further.
CCSM R77/R80/ELITE
- Mark as New
- Bookmark
- Subscribe
- Mute
- Subscribe to RSS Feed
- Permalink
- Report Inappropriate Content
For 7 rules, it takes almost 3 minutes, which is ridiculous : ). I did all my testing, you work for CP, so you are welcome to test it yourself.
Best,
Andy
"Have a great day and if its not, change it"
Andy
"Have a great day and if its not, change it"
- Mark as New
- Bookmark
- Subscribe
- Mute
- Subscribe to RSS Feed
- Permalink
- Report Inappropriate Content
All applicable policy install operations are completing well within a minute or less in my R81 lab.
Test 1: Adding new rules.
Test 2: Adding new services to existing rules.
CCSM R77/R80/ELITE
- Mark as New
- Bookmark
- Subscribe
- Mute
- Subscribe to RSS Feed
- Permalink
- Report Inappropriate Content
Maybe mine is "broken" due to the fact I followed script to fix geo policy being hidden in R81. I will clean install it tomorrow and see what happens.
Andy
Best,
Andy
"Have a great day and if its not, change it"
Andy
"Have a great day and if its not, change it"
- Mark as New
- Bookmark
- Subscribe
- Mute
- Subscribe to RSS Feed
- Permalink
- Report Inappropriate Content
Try testing without the Geo objects if used.
Not seeing those or Updatable objects listed in sk169096 as qualifying for accelerated policy install as yet.
CCSM R77/R80/ELITE
- Mark as New
- Bookmark
- Subscribe
- Mute
- Subscribe to RSS Feed
- Permalink
- Report Inappropriate Content
Ok, so here is what I did...did reinstall of R81 on my standalone lab config and that seemed to fix it. I created 10 rules, few of them geo policy, and it takes 35 seconds to install, so I think its working fine! Thanks guys.
Best,
Andy
"Have a great day and if its not, change it"
Andy
"Have a great day and if its not, change it"
- Mark as New
- Bookmark
- Subscribe
- Mute
- Subscribe to RSS Feed
- Permalink
- Report Inappropriate Content
Keep in mind Accelerated Policy Install will not accelerate all policy installs.
The first install of a newly created policy will take longer for sure.
However, subsequent changes to said policy should be much faster (assuming they are as described in sk169096).
- Mark as New
- Bookmark
- Subscribe
- Mute
- Subscribe to RSS Feed
- Permalink
- Report Inappropriate Content
Thanks Tim.
We actually had the same idea, because we wanted to "show off" how many seconds the accelerated policy installation took. In the upcoming SmartConsole update for R81, we changed the task information for policy installation tasks to show the seconds as well 😀
In general, if you want to see if your policy installation was accelerated, look at the icon. If there's a small lightning there, then it was accelerated. If not, then you can hover over it to see the reason that it wasn't accelerated.
Last, remember that the gateway is also doing some processing during policy installation. This was greatly optimized with the accelerated installation flow, but a heavily loaded gateway may still take longer than a reasonably loaded one.
- Mark as New
- Bookmark
- Subscribe
- Mute
- Subscribe to RSS Feed
- Permalink
- Report Inappropriate Content
On an R80+ SMS all policy install events are logged to a special file $FWDIR/log/install_policy.elg with timestamps. In particular try seeking out **##PERF_MSG_IDENTIFY##** records in that file, as they appear to have the duration information you need, but it is not exactly easy reading:
**##PERF_MSG_IDENTIFY##** {"duration_data":[{"duration":0.4473197529999826,"name":"duration_of_code_generation#A-GW-Cluster"},{"duration":4.560813636999992,"name":"duration_of_policy_commit#A-GW-Cluster"},{"duration":0.9066284540000029,"name":"duration_of_policy_compilation#A-GW-Cluster"},{"duration":0.7535922519999899,"name":"duration_of_policy_transfer#A-GW-Cluster"}]}&CURRENTVERCMP
New Book: "Max Power 2026" Coming Soon
Check Point Firewall Performance Optimization
Check Point Firewall Performance Optimization
- Mark as New
- Bookmark
- Subscribe
- Mute
- Subscribe to RSS Feed
- Permalink
- Report Inappropriate Content
Thanks @Timothy_Hall
That is the file I was looking for but couldn't recall it's name and location.
Regards,
Simon
- Mark as New
- Bookmark
- Subscribe
- Mute
- Subscribe to RSS Feed
- Permalink
- Report Inappropriate Content
What Chris said is pretty much the only way I know...you can see the percentage mind you, not the time itself, so technically, there is really no way to know how much time had elapsed since the policy install began. But, thats something that sounds like a nice feature CP could add in the future.
Best,
Andy
"Have a great day and if its not, change it"
Andy
"Have a great day and if its not, change it"
Leaderboard
Epsum factorial non deposit quid pro quo hic escorol.
| User | Count |
|---|---|
| 31 | |
| 20 | |
| 18 | |
| 14 | |
| 9 | |
| 8 | |
| 8 | |
| 8 | |
| 8 | |
| 7 |
Upcoming Events
Thu 12 Mar 2026 @ 05:00 PM (CET)
AI Security Masters Session 5: Powering Prevention: The AI Driving Check Point’s ThreatCloudTue 17 Mar 2026 @ 03:00 PM (CET)
From SASE to Hybrid Mesh: Securing Enterprise AI at Scale - EMEATue 17 Mar 2026 @ 02:00 PM (EDT)
From SASE to Hybrid Mesh: Securing Enterprise AI at Scale - AMERWed 18 Mar 2026 @ 10:00 AM (CET)
The Cloud Architects Series: An introduction to Check Point Hybrid Mesh in 2026 - In Seven LanguagesThu 12 Mar 2026 @ 05:00 PM (CET)
AI Security Masters Session 5: Powering Prevention: The AI Driving Check Point’s ThreatCloudTue 17 Mar 2026 @ 03:00 PM (CET)
From SASE to Hybrid Mesh: Securing Enterprise AI at Scale - EMEATue 17 Mar 2026 @ 02:00 PM (EDT)
From SASE to Hybrid Mesh: Securing Enterprise AI at Scale - AMERWed 18 Mar 2026 @ 10:00 AM (CET)
The Cloud Architects Series: An introduction to Check Point Hybrid Mesh in 2026 - In Seven LanguagesTue 24 Mar 2026 @ 06:00 PM (COT)
San Pedro Sula: Spark Firewall y AI-Powered Security ManagementThu 26 Mar 2026 @ 06:00 PM (COT)
Tegucigalpa: Spark Firewall y AI-Powered Security ManagementAbout CheckMates
Learn Check Point
Advanced Learning
YOU DESERVE THE BEST SECURITY
©1994-2026 Check Point Software Technologies Ltd. All rights reserved.
Copyright
Privacy Policy
About Us
UserCenter


