- Products
Network & SASE IoT Protect Maestro Management OpenTelemetry/Skyline Remote Access VPN SASE SD-WAN Security Gateways SmartMove Smart-1 Cloud SMB Gateways (Spark) Threat PreventionCloud Cloud Network Security CloudMates General CloudGuard - WAF Talking Cloud Podcast Weekly ReportsSecurity Operations Events External Risk Management Incident Response Infinity AI Infinity Portal NDR Playblocks SOC XDR/XPR Threat Exposure Management
- Learn
- Local User Groups
- Partners
- More
This website uses Cookies. Click Accept to agree to our website's cookie use as described in our Privacy Policy. Click Preferences to customize your cookie settings.
- Products
- AI Security
- Developers & More
- Check Point Trivia
- CheckMates Toolbox
- General Topics
- Products Announcements
- Threat Prevention Blog
- Upcoming Events
- Americas
- EMEA
- Czech Republic and Slovakia
- Denmark
- Netherlands
- Germany
- Sweden
- United Kingdom and Ireland
- France
- Spain
- Norway
- Ukraine
- Baltics and Finland
- Greece
- Portugal
- Austria
- Kazakhstan and CIS
- Switzerland
- Romania
- Turkey
- Belarus
- Belgium & Luxembourg
- Russia
- Poland
- Georgia
- DACH - Germany, Austria and Switzerland
- Iberia
- Africa
- Adriatics Region
- Eastern Africa
- Israel
- Nordics
- Middle East and Africa
- Balkans
- Italy
- Bulgaria
- Cyprus
- APAC
AI Security Masters
E1: How AI is Reshaping Our World
MVP 2026: Submissions
Are Now Open!
What's New in R82.10?
Watch NowOverlap in Security Validation
Help us to understand your needs better
CheckMates Go:
Maestro Madness
Turn on suggestions
Auto-suggest helps you quickly narrow down your search results by suggesting possible matches as you type.
Showing results for
- CheckMates
- :
- Products
- :
- Network & SASE
- :
- Management
- :
- Re: Number of connections depending on dst address...
Options
- Subscribe to RSS Feed
- Mark Topic as New
- Mark Topic as Read
- Float this Topic for Current User
- Bookmark
- Subscribe
- Mute
- Printer Friendly Page
Turn on suggestions
Auto-suggest helps you quickly narrow down your search results by suggesting possible matches as you type.
Showing results for
Are you a member of CheckMates?
×
Sign in with your Check Point UserCenter/PartnerMap account to access more great content and get a chance to win some Apple AirPods! If you don't have an account, create one now for free!
- Mark as New
- Bookmark
- Subscribe
- Mute
- Subscribe to RSS Feed
- Permalink
- Report Inappropriate Content
Number of connections depending on dst addresses
Hi!
We have a certain group of destination addresses. We need to calculate the total number of connections for this group for a certain period of time. How can we do this at R80.10 in SmartConsole as well as from cli? It is necessary exactly the number of connections, not events.
Thank you!
20 Replies
- Mark as New
- Bookmark
- Subscribe
- Mute
- Subscribe to RSS Feed
- Permalink
- Report Inappropriate Content
fw tab -u -t connections | awk '{ print $4 }' | sort -n | uniq -c | sort -nr | head -10
This will show the top ten destination IPs hogging slots in the connection table in descending order, however you will need to manually convert the IP addresses displayed from hex to decimal like so: 0a1e0b53 = 10.30.11.83. For the top 10 sources, substitute $2 for $4 in the awk command above. A variant of this command utilizing grep can be used to look for certain IP addresses or subnets.
--
My book "Max Power: Check Point Firewall Performance Optimization"
now available via http://maxpowerfirewalls.com.
Gaia 4.18 (R82) Immersion Tips, Tricks, & Best Practices Video Course
Now Available at https://shadowpeak.com/gaia4-18-immersion-course
Now Available at https://shadowpeak.com/gaia4-18-immersion-course
- Mark as New
- Bookmark
- Subscribe
- Mute
- Subscribe to RSS Feed
- Permalink
- Report Inappropriate Content
Dear Tim,
Thanks for a quick response! Can we see this information from SmartConsole?
- Mark as New
- Bookmark
- Subscribe
- Mute
- Subscribe to RSS Feed
- Permalink
- Report Inappropriate Content
There is a way to do this in SmartView Tracker (the so-called "Active Connections" view).
While there is no shortcut to SmartView Tracker installed, you can find the binary in C:\Program Files (x86)\CheckPoint\SmartConsole\R80.10\PROGRAM as CPlgv.exe
And, as it turns out, this function still works (performance implications apply).
You can filter the results as desired.
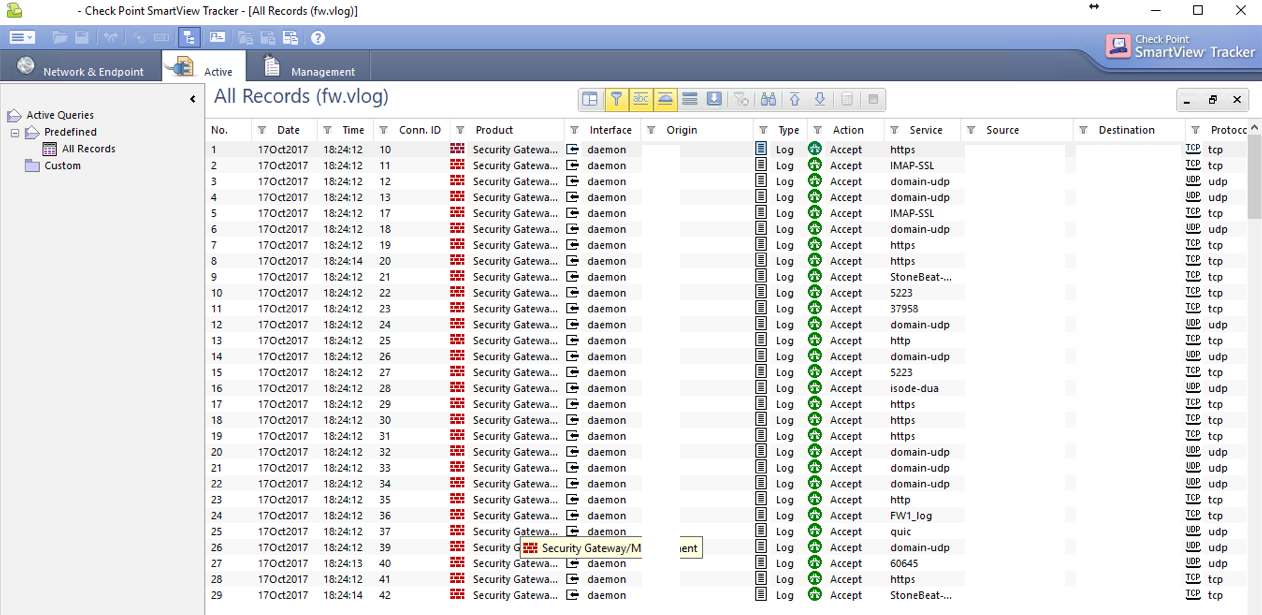
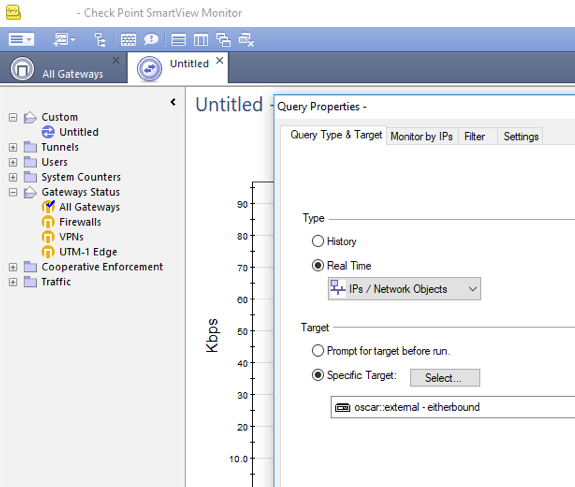
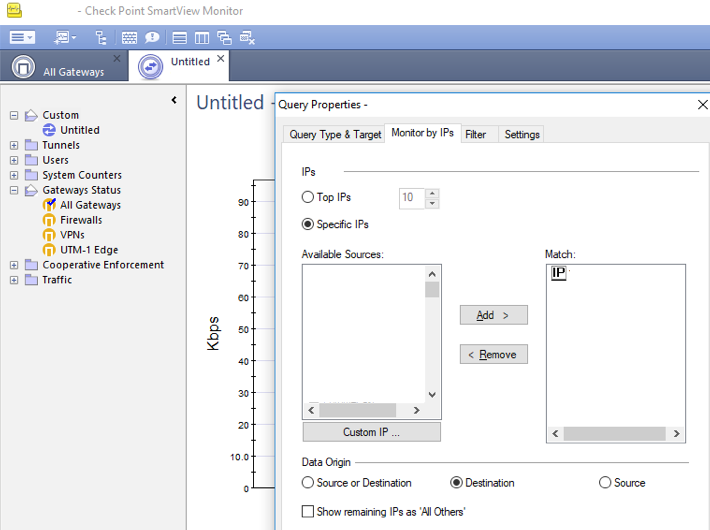
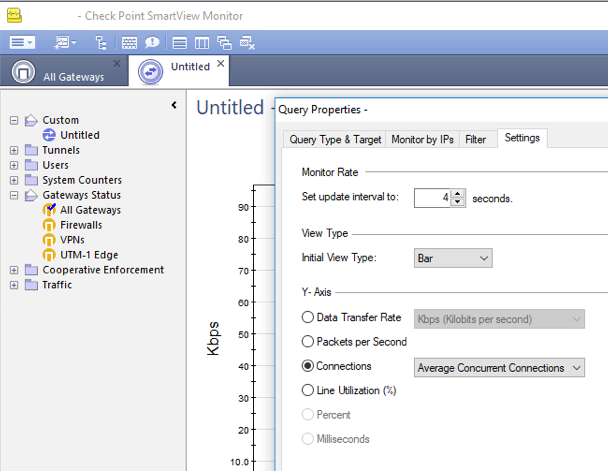
You can also do this in SmartView Monitor to track this over time, if you enable Monitoring on the relevant Gateway object.
In R80+:
- Open SmartConsole > Logs & Monitor.
- Open the catalog (new tab).
- Click Tunnel & User Monitoring.
See also: Logging and Monitoring R80.10 (Part of Check Point Infinity)
- Mark as New
- Bookmark
- Subscribe
- Mute
- Subscribe to RSS Feed
- Permalink
- Report Inappropriate Content
Oh boy, not the Active Connections, please. that can blow your production FWs in an instance. I would look into connection table on CLI instead
- Mark as New
- Bookmark
- Subscribe
- Mute
- Subscribe to RSS Feed
- Permalink
- Report Inappropriate Content
...and I see Tim posted the command already
- Mark as New
- Bookmark
- Subscribe
- Mute
- Subscribe to RSS Feed
- Permalink
- Report Inappropriate Content
Completely agree, just providing all the options.
- Mark as New
- Bookmark
- Subscribe
- Mute
- Subscribe to RSS Feed
- Permalink
- Report Inappropriate Content
Dameon,
Tell me, please, what about the R80.10 version? Is it possible to generate reports with the number of connections in the SmartConsole? As I understand we must look in the direction of the Network Activity report?
- Mark as New
- Bookmark
- Subscribe
- Mute
- Subscribe to RSS Feed
- Permalink
- Report Inappropriate Content
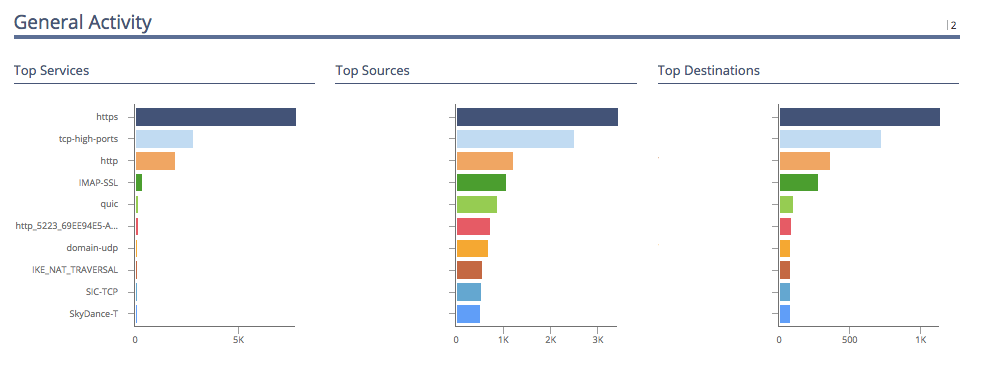
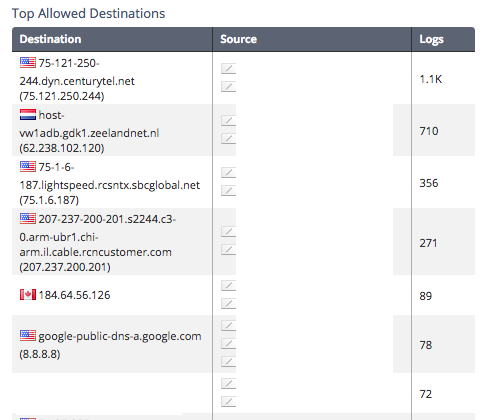
The methods we've discussed thus far have been methods to determine this in realtime.
The Network Analysis report (which is in R80.10 and might be in earlier releases) is from SmartEvent and is based on logs.
A couple of snapshots from this report are below.
- Mark as New
- Bookmark
- Subscribe
- Mute
- Subscribe to RSS Feed
- Permalink
- Report Inappropriate Content
Hi,
I want to check active connection log in R80.10 but unable to see.
Could you please suggest how to check?
I want to check active connection log in R80.10 but unable to see.
Could you please suggest how to check?
Regards,
Vivek Kumar
Vivek Kumar
- Mark as New
- Bookmark
- Subscribe
- Mute
- Subscribe to RSS Feed
- Permalink
- Report Inappropriate Content
Hello Tim,
Does this command exclude symbolic links? Following the sk65133, for one connection there can be 4 entries in the table.
- Mark as New
- Bookmark
- Subscribe
- Mute
- Subscribe to RSS Feed
- Permalink
- Report Inappropriate Content
The command does not exclude symbolic links; it was more designed to show you which IP addresses were hogging the most slots in the connection table, not necessarily the precise number of connections per IP.
--
My book "Max Power: Check Point Firewall Performance Optimization"
now available via http://maxpowerfirewalls.com.
Gaia 4.18 (R82) Immersion Tips, Tricks, & Best Practices Video Course
Now Available at https://shadowpeak.com/gaia4-18-immersion-course
Now Available at https://shadowpeak.com/gaia4-18-immersion-course
- Mark as New
- Bookmark
- Subscribe
- Mute
- Subscribe to RSS Feed
- Permalink
- Report Inappropriate Content
Ok, thanks, and how can we know the precise number of connections per IP via cli?
- Mark as New
- Bookmark
- Subscribe
- Mute
- Subscribe to RSS Feed
- Permalink
- Report Inappropriate Content
fw tab -u -t connections | awk '{ print $4 }' | sort -n | uniq -c | sort -nr | head -10 would give the number of sessions per destination ip at a given time but not for a period of time, right?
By the way, with -f you can get the output formatted in decimal dotted format
fw tab -u -t connections -f | awk '{ print $13 }' | sort -n | uniq -c | sort -nr | head -10
- Mark as New
- Bookmark
- Subscribe
- Mute
- Subscribe to RSS Feed
- Permalink
- Report Inappropriate Content
Sorry I forgot to mention that you need to grep Rule otherwise you get pretty much 4 events/ symbolic per connection
fw tab -u -t connections -f | grep Rule | awk '{ print $13 }' | sort -n | uniq -c | sort -nr | head -10
- Mark as New
- Bookmark
- Subscribe
- Mute
- Subscribe to RSS Feed
- Permalink
- Report Inappropriate Content
You could get that information with this script
showtable.sh - it shows statistics of the connections, fxw_cache and sam_blocked_ips tables
./showtable.sh connections global list:20:d
- Mark as New
- Bookmark
- Subscribe
- Mute
- Subscribe to RSS Feed
- Permalink
- Report Inappropriate Content
Unfortunately, my access to this script is restrict.
- Mark as New
- Bookmark
- Subscribe
- Mute
- Subscribe to RSS Feed
- Permalink
- Report Inappropriate Content
The script was probably in the moderation queue when you tried to access it.
It's not now, please try again.
- Mark as New
- Bookmark
- Subscribe
- Mute
- Subscribe to RSS Feed
- Permalink
- Report Inappropriate Content
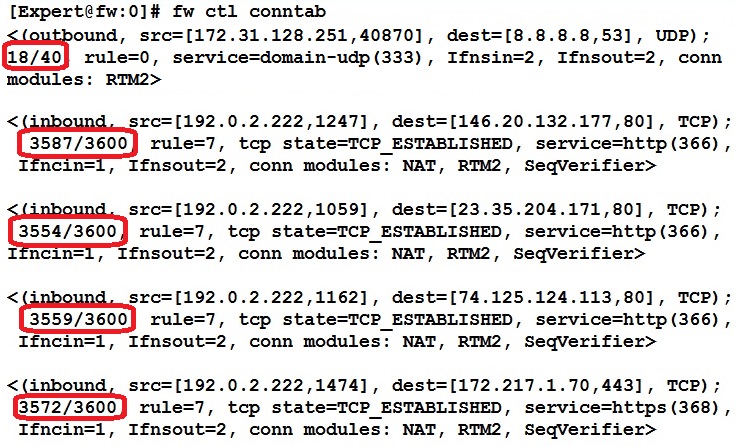
Since this thread still appears to be going strong, just wanted to mention the undocumented fw ctl conntab command which presents a very pretty and concise look at the connections state table similar to fw tab -f -u -t connections including idle timers (highlighted):
--
My book "Max Power: Check Point Firewall Performance Optimization"
now available via http://maxpowerfirewalls.com.
Gaia 4.18 (R82) Immersion Tips, Tricks, & Best Practices Video Course
Now Available at https://shadowpeak.com/gaia4-18-immersion-course
Now Available at https://shadowpeak.com/gaia4-18-immersion-course
- Mark as New
- Bookmark
- Subscribe
- Mute
- Subscribe to RSS Feed
- Permalink
- Report Inappropriate Content
I am wondering why fw ctl conntab | grep -c "<" and fw tab -t connections -s don't match
# fw ctl conntab | grep -c "<"
1619
# fw tab -t connections -s
HOST NAME ID #VALS #PEAK #SLINKS
localhost connections 8158 4947 159162 12074
- Mark as New
- Bookmark
- Subscribe
- Mute
- Subscribe to RSS Feed
- Permalink
- Report Inappropriate Content
I saw this behavior here using three different tools like you did: fw ctl conntab ; Smart Monitor ; fw tab connections and I was no able to trust on the information gave to me...
Leaderboard
Epsum factorial non deposit quid pro quo hic escorol.
| User | Count |
|---|---|
| 17 | |
| 15 | |
| 8 | |
| 5 | |
| 5 | |
| 5 | |
| 4 | |
| 4 | |
| 4 | |
| 4 |
Upcoming Events
Thu 18 Dec 2025 @ 10:00 AM (CET)
Cloud Architect Series - Building a Hybrid Mesh Security Strategy across cloudsThu 08 Jan 2026 @ 05:00 PM (CET)
AI Security Masters Session 1: How AI is Reshaping Our WorldThu 18 Dec 2025 @ 10:00 AM (CET)
Cloud Architect Series - Building a Hybrid Mesh Security Strategy across cloudsThu 08 Jan 2026 @ 05:00 PM (CET)
AI Security Masters Session 1: How AI is Reshaping Our WorldAbout CheckMates
Learn Check Point
Advanced Learning
YOU DESERVE THE BEST SECURITY
©1994-2025 Check Point Software Technologies Ltd. All rights reserved.
Copyright
Privacy Policy
About Us
UserCenter


