- Products
- Learn
- Local User Groups
- Partners
- More

This website uses Cookies. Click Accept to agree to our website's cookie use as described in our Privacy Policy. Click Preferences to customize your cookie settings.
- Products
- Learn
- Local User Groups
- Upcoming Events
- Americas
- EMEA
- Czech Republic and Slovakia
- Denmark
- Netherlands
- Germany
- Sweden
- United Kingdom and Ireland
- France
- Spain
- Norway
- Ukraine
- Baltics and Finland
- Greece
- Portugal
- Austria
- Kazakhstan and CIS
- Switzerland
- Romania
- Turkey
- Belarus
- Belgium & Luxembourg
- Russia
- Poland
- Georgia
- DACH - Germany, Austria and Switzerland
- Iberia
- Africa
- Adriatics Region
- Eastern Africa
- Israel
- Nordics
- Middle East and Africa
- Balkans
- Italy
- Bulgaria
- Cyprus
- APAC
- Partners
- More
- ABOUT CHECKMATES & FAQ
- Sign In
- Leaderboard
- Events
The Great Exposure Reset
24 February 2026 @ 5pm CET / 11am EST
CheckMates Fest 2026
Watch Now!AI Security Masters
Hacking with AI: The Dark Side of Innovation
CheckMates Go:
CheckMates Fest
Turn on suggestions
Auto-suggest helps you quickly narrow down your search results by suggesting possible matches as you type.
Showing results for
- CheckMates
- :
- Products
- :
- Hybrid Mesh
- :
- Firewall and Security Management
- :
- Re: Mangement server R80.10 slowness
Options
- Subscribe to RSS Feed
- Mark Topic as New
- Mark Topic as Read
- Float this Topic for Current User
- Bookmark
- Subscribe
- Mute
- Printer Friendly Page
Turn on suggestions
Auto-suggest helps you quickly narrow down your search results by suggesting possible matches as you type.
Showing results for
Are you a member of CheckMates?
×
Sign in with your Check Point UserCenter/PartnerMap account to access more great content and get a chance to win some Apple AirPods! If you don't have an account, create one now for free!
- Mark as New
- Bookmark
- Subscribe
- Mute
- Subscribe to RSS Feed
- Permalink
- Report Inappropriate Content
Jump to solution
Mangement server R80.10 slowness
Hi,
I experiencing a loooot of slowness issue on my management server.
The management server is on R80.10 and the gateways are running on R77.30.
I keep running to a problem where java process hogs up all the available CPU and I'm unable to do anything at this point. Sometimes, the SmartConsole stops responding and closes. When trying to reconnect, I keep getting an Operation Timeout error. After some time, java process consumption eventually goes down and only after that I'm able to re login.
The management server runs on a VM with 24GB RAM and 4 CPU cores.
Somebody here has already get an issue like this one ?
Thanks for your help
PS: top, sar, and iostat attached.
1 Solution
Accepted Solutions
- Mark as New
- Bookmark
- Subscribe
- Mute
- Subscribe to RSS Feed
- Permalink
- Report Inappropriate Content
SOLR performs log indexing and does use a lot of CPU (which is expected) but notice that SOLR and the associated log_indexer process show a nice (NI) value of 19 in top, which indicates those processes are running with the lowest CPU priority possible. So if literally any other process needs a CPU, these indexer processes will be immediately thrown off to make way for the other process. Very unlikely that these are causing the SmartConsole hangs you are seeing, unless they are saturating the disk channel to the point of affecting other processes which does not appear to be happening.
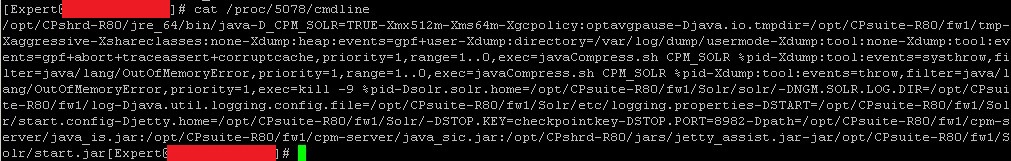
Please provide output of ps -efwww | grep 5078, would like to see what that java process is since it isn't showing up in cpwd_admin list.
Looking like the SMS just needs more CPUs as that is the only thing apparently holding you back.
--
Second Edition of my "Max Power" Firewall Book
Now Available at http://www.maxpowerfirewalls.com
Gaia 4.18 (R82) Immersion Tips, Tricks, & Best Practices Video Course
Now Available at https://shadowpeak.com/gaia4-18-immersion-course
Now Available at https://shadowpeak.com/gaia4-18-immersion-course
29 Replies
- Mark as New
- Bookmark
- Subscribe
- Mute
- Subscribe to RSS Feed
- Permalink
- Report Inappropriate Content
try this thread - https://community.checkpoint.com/message/11361-re-management-server-slowness-in-r8010?commentID=1136....
Robert.
- Mark as New
- Bookmark
- Subscribe
- Mute
- Subscribe to RSS Feed
- Permalink
- Report Inappropriate Content
Hi Robert,
Thanks for you quick answer. However the other thread is not exactly the same as i had also "postgress" process using CPU and not the same take.
But yes, definitively similar, without real solution for now...
- Mark as New
- Bookmark
- Subscribe
- Mute
- Subscribe to RSS Feed
- Permalink
- Report Inappropriate Content
Nevertheless, your feedback is very important, I'll forward it to our management server team.
Robert.
- Mark as New
- Bookmark
- Subscribe
- Mute
- Subscribe to RSS Feed
- Permalink
- Report Inappropriate Content
thx!
If another logs or informations could be helpful please let me know.
- Mark as New
- Bookmark
- Subscribe
- Mute
- Subscribe to RSS Feed
- Permalink
- Report Inappropriate Content
Based on your screenshots, the SMS does not appear to be constrained for memory or disk I/O bandwidth.
Keep in mind 4 CPUs is the *minimum* for an R80+ SMS, any chance you can go to 8 discrete CPUs? "Discrete" in this case means 8 separate CPUs, not 4 CPUs w/ 2 cores each. Hyperthreading or having multiple cores per CPU is not recommended on an SMS for performance reasons.
Beyond that we'll need to know which specific java process is chewing CPU, typically there are six of them on an R80+ SMS. Next time you have the problem, identify the PID of the CPU hog with ps or top, then run cpwd_admin list to determine which specific java process (and its associated function) is the issue and we can diagnose further.
--
Second Edition of my "Max Power" Firewall Book
Now Available at http://www.maxpowerfirewalls.com
Gaia 4.18 (R82) Immersion Tips, Tricks, & Best Practices Video Course
Now Available at https://shadowpeak.com/gaia4-18-immersion-course
Now Available at https://shadowpeak.com/gaia4-18-immersion-course
- Mark as New
- Bookmark
- Subscribe
- Mute
- Subscribe to RSS Feed
- Permalink
- Report Inappropriate Content
Thanks for the first confirmation about I/O and memory.
Regarding the CPU, I need to talk with my virtualization team.
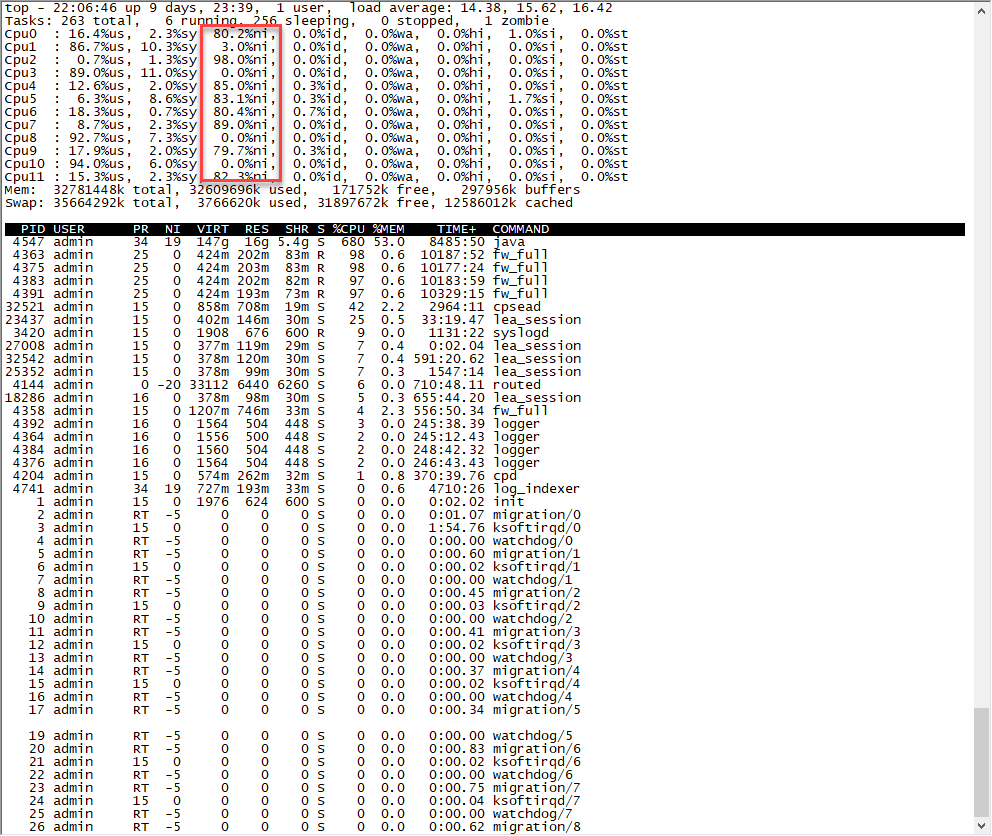
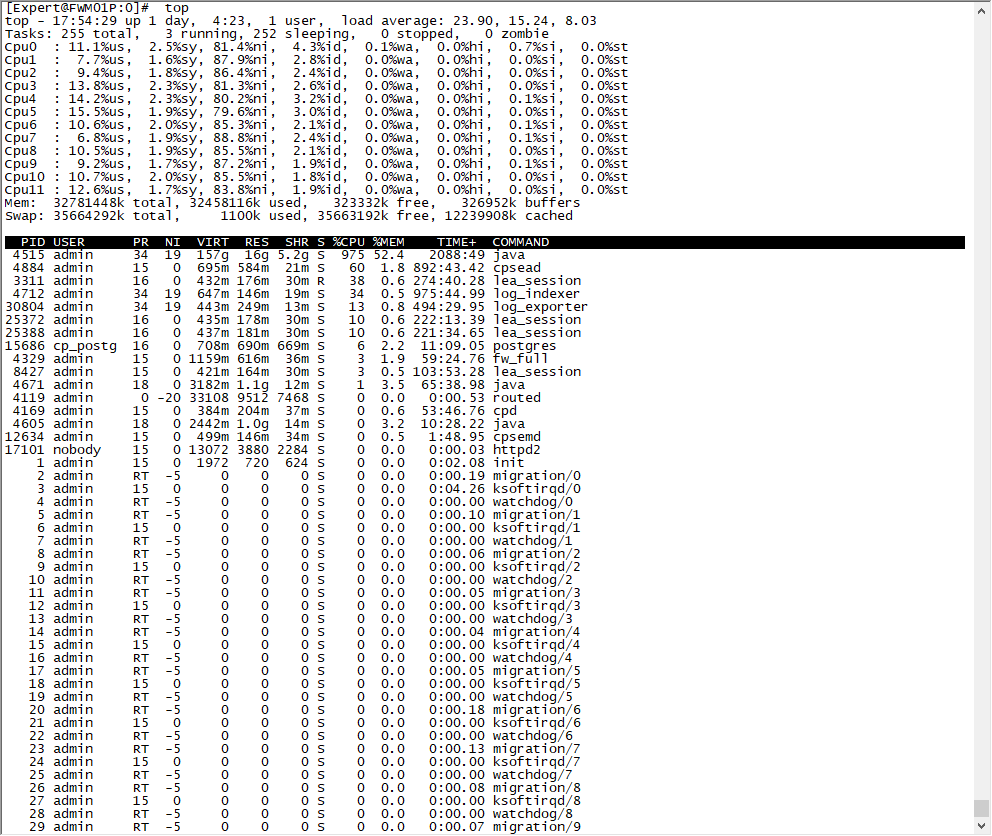
regarding the specific java process, as you can see in the new screenshot, SOLR is involved:
Indeed, log indexing is enabled on this SMS. But what is the CPU consumption baseline ?
- Mark as New
- Bookmark
- Subscribe
- Mute
- Subscribe to RSS Feed
- Permalink
- Report Inappropriate Content
SOLR performs log indexing and does use a lot of CPU (which is expected) but notice that SOLR and the associated log_indexer process show a nice (NI) value of 19 in top, which indicates those processes are running with the lowest CPU priority possible. So if literally any other process needs a CPU, these indexer processes will be immediately thrown off to make way for the other process. Very unlikely that these are causing the SmartConsole hangs you are seeing, unless they are saturating the disk channel to the point of affecting other processes which does not appear to be happening.
Please provide output of ps -efwww | grep 5078, would like to see what that java process is since it isn't showing up in cpwd_admin list.
Looking like the SMS just needs more CPUs as that is the only thing apparently holding you back.
--
Second Edition of my "Max Power" Firewall Book
Now Available at http://www.maxpowerfirewalls.com
Gaia 4.18 (R82) Immersion Tips, Tricks, & Best Practices Video Course
Now Available at https://shadowpeak.com/gaia4-18-immersion-course
Now Available at https://shadowpeak.com/gaia4-18-immersion-course
- Mark as New
- Bookmark
- Subscribe
- Mute
- Subscribe to RSS Feed
- Permalink
- Report Inappropriate Content
Can't agree more. Add CPUs. If you had this HW set up with R77.30 then double it as a minimum for R80.10. it's rather resource hungry. For good reason - you get a lot in return. We quadrupled VM specs after upgrade to have reasonable performance.
- Mark as New
- Bookmark
- Subscribe
- Mute
- Subscribe to RSS Feed
- Permalink
- Report Inappropriate Content
And hopefully disk access slowness will be resolved in R80.20 with faster and more efficient file system
- Mark as New
- Bookmark
- Subscribe
- Mute
- Subscribe to RSS Feed
- Permalink
- Report Inappropriate Content
Nice ![]()
- Mark as New
- Bookmark
- Subscribe
- Mute
- Subscribe to RSS Feed
- Permalink
- Report Inappropriate Content
Looks really better after increasing to 8 CPU.
Thanks a lot !
Do you have a sheet or a recommendation based on the utilization ?
Eg: 1 SMS without SmartLog vs with SmartLog, if we have 1 managed firewall vs 15 manged, ...
I mean, real life recommendation, based on your personnal experience.
Thx
- Mark as New
- Bookmark
- Subscribe
- Mute
- Subscribe to RSS Feed
- Permalink
- Report Inappropriate Content
A lot depends on the logging rate from the managed gateways which can vary considerably between different sites; the Smart-1 datasheets do show the indexed logging rate capacity for the various Smart-1 appliances, and once the number of Smart-1 cores is taken into consideration from this list you can get a general sense of overall capacity. SMS performance is a bit tough to predict or make general recommendations for, other than the following which is my personal opinion:
1) Minimum - 4 discrete (non-hyperthreaded) cores, 8 GB RAM
2) Better - 8 discrete cores, 16GB RAM
I did a bit of testing awhile back, and 8 discrete cores for an R80+ SMS seems to be the sweet spot. As the number of cores was increased from 4 to 8, it was easy to see a fairly linear increase in management performance. Above 8 cores there was still some minor improvement but it seemed to be mostly past the point of diminishing returns.
Allocating more than 16GB of RAM certainly won't hurt, but it will primarily get used for caching disk operations unless you have a very large configuration or are using MDM/Provider-1.
I think the above stems from the fact that there are 6 key java-based processes on an R80+ SMS, which are well-known for trying to soak up all the system resources you can throw at them in an attempt to run faster. When the Linux kernel is updated to 3.10 enabling hyperthreading might help further (and may improve many other areas such as using "huge" memory pages), but the current consensus is to leave hyperthreading off on a 2.6.18 kernel R80/R80.10 SMS due to exacerbating possible bottlenecks in the older I/O channel drivers.
--
Second Edition of my "Max Power" Firewall Book
Now Available at http://www.maxpowerfirewalls.com
Gaia 4.18 (R82) Immersion Tips, Tricks, & Best Practices Video Course
Now Available at https://shadowpeak.com/gaia4-18-immersion-course
Now Available at https://shadowpeak.com/gaia4-18-immersion-course
- Mark as New
- Bookmark
- Subscribe
- Mute
- Subscribe to RSS Feed
- Permalink
- Report Inappropriate Content
Perfect, thanks a lot!
- Mark as New
- Bookmark
- Subscribe
- Mute
- Subscribe to RSS Feed
- Permalink
- Report Inappropriate Content
Tim Hall wrote:
...there is no way to prioritize disk access, it is just FIFO...
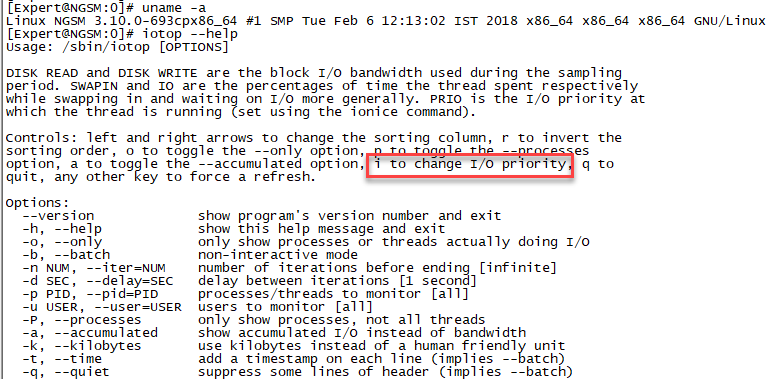
Linux kernel can prioritize IO access (including disk access) for read operations and synchronous write operations. Gaia contains a very old kernel (2.6.18 based on the kernel from RHEL 5.2) but it already supports IO priorities using the CLI tool ionice. If there is a lot of IO operations (check vmstat) it is possible to manually lower the IO priority of a running process to test if it helps. I did not test it yet. There is also a tool "iotop" which can show IO operations of individual processes but I am afraid that the Gaia's kernel lacks support for it.
Newer Linux kernels by default also set the IO priority when you set the CPU priority. So it is possible that in R80.20 some processes will have a lower IO priority. If anyone has EA of the new Gaia you can check it using ionice -p $PID. (Replace $PID by the PID of the process to check.)
- Mark as New
- Bookmark
- Subscribe
- Mute
- Subscribe to RSS Feed
- Permalink
- Report Inappropriate Content
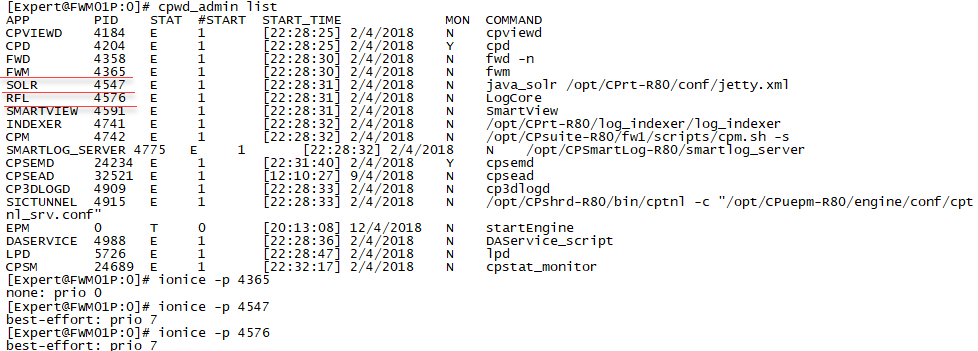
Thanks for the clarification Václav Brožík, for some reason I thought CFQ was available in 2.6.18 but not enabled by default. As you stated it is enabled by default starting in 2.6.18 and follows the CPU nice priority, so processes SOLR and LogCore show via ionice -p PID a lowered I/O priority of 7, while all other processes have the higher priority 0 on a SMS. On an R80.10 SMS, it doesn't look like Check Point has directly tweaked the I/O priorities beyond the two processes mentioned above. The iotop tool will be very helpful on an SMS after the upcoming Gaia kernel update.
--
Second Edition of my "Max Power" Firewall Book
Now Available at http://www.maxpowerfirewalls.com
Gaia 4.18 (R82) Immersion Tips, Tricks, & Best Practices Video Course
Now Available at https://shadowpeak.com/gaia4-18-immersion-course
Now Available at https://shadowpeak.com/gaia4-18-immersion-course
- Mark as New
- Bookmark
- Subscribe
- Mute
- Subscribe to RSS Feed
- Permalink
- Report Inappropriate Content
Thanks for provide this kind of information about this new kernel feature.
But do you mean I can toggle i to change priority of Solr or LogCore process?
- Mark as New
- Bookmark
- Subscribe
- Mute
- Subscribe to RSS Feed
- Permalink
- Report Inappropriate Content
Hi Rick,
You can adjust the I/O priority of any process you want with the ionice command. However the SOLR and LogCore processes are already set to the lowest I/O priority possible by virtue of having their CPU priority ("nice" value) already lowered by Check Point "out of the box". I would most definitely NOT recommend raising the I/O or CPU priority of these two processes on a SMS, Check Point re-niced their priority downwards for a good reason.
--
Second Edition of my "Max Power" Firewall Book
Now Available at http://www.maxpowerfirewalls.com
Gaia 4.18 (R82) Immersion Tips, Tricks, & Best Practices Video Course
Now Available at https://shadowpeak.com/gaia4-18-immersion-course
Now Available at https://shadowpeak.com/gaia4-18-immersion-course
- Mark as New
- Bookmark
- Subscribe
- Mute
- Subscribe to RSS Feed
- Permalink
- Report Inappropriate Content
I have checked ionice in one of my R80.10 (JHFA 70) installations and I have a little bit different results:
1. nice does not change ionice:
[Expert@sms:0]# nice -n19 sleep 100 & ionice -p$!
[1] 21846
none: prio 0
2. SOLR has the basic IO priority:
[Expert@sms:0]# ionice -p"$(pgrep -f CPM_SOLR)"
none: prio 0
3. LogCore has the lowest best-effort IO priority:
[Expert@sms:0]# ionice -p"$(pgrep -f LogCore)"
best-effort: prio 7
- Mark as New
- Bookmark
- Subscribe
- Mute
- Subscribe to RSS Feed
- Permalink
- Report Inappropriate Content
This is in one of my customer installed with R80.10 Jumbo HFA T70 situation.
- Mark as New
- Bookmark
- Subscribe
- Mute
- Subscribe to RSS Feed
- Permalink
- Report Inappropriate Content
Hi Rick, try running this from expert mode:
ps -ef | awk '{ print $2 }' | xargs -i -t ionice -p {} \;
In my output on an 8GB RAM, 8-core Take42 standalone R80.10 SMS I'm seeing two processes with a modified ionice priority:
ionice -p 9656 ;
best-effort: prio 7
ionice -p 9685 ;
best-effort: prio 7
And those processes are:
SOLR 9656 E 1 [06:35:24] 13/4/2018 N java_solr /opt/CPrt-R80/conf/jetty.xml
RFL 9685 E 1 [06:35:24] 13/4/2018 N LogCore
Not sure why you are seeing something different in regards to priorities, but your post did send me off on a noble quest to determine exactly how these processes are being reniced and ioniced. Took awhile but what I found is below, you should be able to figure out why things look different on your system with this information as all of the code involved is shell scripts:
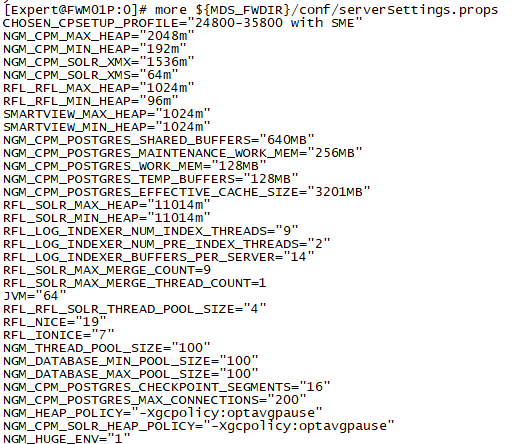
1) CPU and I/O nice values are set in the ${MDS_FWDIR}/conf/serverSettings.props file:
RFL_NICE="19"
RFL_IONICE="7"
This is a verrrrrry interesting file from a SMS tuning perspective as it does not appear to be documented, and you can set all kinds of other java tuning information in here like heap, memory and buffer sizes for the various java-based processes on the SMS. However I would most definitely NOT advise directly tampering with the variables in this file without consulting Check Point TAC. There also appear to be different versions of this file based on the detected hardware specifications of your SMS (via CHOSEN_CPSETUP_PROFILE="Small Medium env resources profile" in my initial setup) which may explain the discrepancy you are seeing.
This then made me wonder if the detection of SMS hardware specifications was only performed when the SMS was first initialized, or every time the SMS was booted. The implication for the former would be that an older profile would still be used even after increasing the hardware specifications of the SMS due to performance problems. However I'm pleased to report that this detection is performed every time the SMS is booted, since after cranking my SMS's RAM from 8GB to 24GB and rebooting I now see CHOSEN_CPSETUP_PROFILE="Large env resources profile with SME or Dedicated Log Server" and many of the heap/memory/buffer variables have been increased substantially.
Of course then I wanted to see all the different SMS performance profiles and what their various hardware thresholds were, and was able to find them contained in the file $CPDIR/conf/CpSetupInfo_resourceProfiles.conf. This file is pretty lengthy and really shows how Check Point painstakingly modeled a lot of different SMS performance situations based on hardware specifications, bravo! If someone wants to parse through this file and lay out all the various thresholds and breakpoints feel free, I've already gone way way too far down the rabbit hole here... 🙂
2) These variables flow into two shell scripts (via a source $MDS_FWDIR/conf/serverSettings.props statement) that are used to start LogCore and SOLR:
/opt/CPrt-R80/bin/java_solr
/opt/CPrt-R80/bin/LogCore
3) These scripts in turn call the shell script /opt/CPshrd-R80/bin/runJavaProcess which sets the CPU and I/O nice values upon invocation of these specific processes if the $RFL_NICE and $RFL_IONICE variables are set.
--
Second Edition of my "Max Power" Firewall Book
Now Available at http://www.maxpowerfirewalls.com
Gaia 4.18 (R82) Immersion Tips, Tricks, & Best Practices Video Course
Now Available at https://shadowpeak.com/gaia4-18-immersion-course
Now Available at https://shadowpeak.com/gaia4-18-immersion-course
- Mark as New
- Bookmark
- Subscribe
- Mute
- Subscribe to RSS Feed
- Permalink
- Report Inappropriate Content
Hi Tim
My customer SMS run on an open server IBM X3650 M4 (from 3 years ago).
This server setting apply with "24800-35800 with SME" profile.
two physical CPU with E5-2620 v2 2.10GHz( each with six cores instance)

When I run this view or Security CheckUp Report
Default time period is 7 days.

top status after run some kind of view or report 3~4 mins.
- Mark as New
- Bookmark
- Subscribe
- Mute
- Subscribe to RSS Feed
- Permalink
- Report Inappropriate Content
Hi Rick,
Looks like SOLR is soaking up all the CPU resources it can in an attempt to run faster, but at least as far as CPU consumption it is niced down to minimum CPU priority. What does ionice -p 4515 show? As long as it says "7" what you are seeing here shouldn't cause any performance problems and I'd say this is expected behavior for a SMS with a high logging rate. What do the cpstat -f indexer mg and cpstat -f log_server mg commands show on this SMS, and how many gateways is it managing?
--
Second Edition of my "Max Power" Firewall Book
Now Available at http://www.maxpowerfirewalls.com
Gaia 4.18 (R82) Immersion Tips, Tricks, & Best Practices Video Course
Now Available at https://shadowpeak.com/gaia4-18-immersion-course
Now Available at https://shadowpeak.com/gaia4-18-immersion-course
- Mark as New
- Bookmark
- Subscribe
- Mute
- Subscribe to RSS Feed
- Permalink
- Report Inappropriate Content
Yes, 4515 is priority 7.
ionice -p 4515 ; best-effort: prio 7
This SMS only manage one (NGTX enabled) gateway.
The connection table peak 114K, but average is 30K-50K connections.

- Mark as New
- Bookmark
- Subscribe
- Mute
- Subscribe to RSS Feed
- Permalink
- Report Inappropriate Content
Even though it is properly nice'd, that level of CPU utilization by SOLR seems a bit excessive given the number of managed gateways and logging rate. Assuming you have not already applied the latest GA R80.10 Jumbo HFA (Take 91 as of this posting), a call into Check Point TAC is probably in order so they can do some debugs on SOLR and see why the heck it is so busy. The debug instructions are located in sk105806: How to debug SmartEvent NGSE / R80 / R80.10 processes, but making sense of what the debugs show is another matter entirely and outside my expertise. 🙂
--
Second Edition of my "Max Power" Firewall Book
Now Available at http://www.maxpowerfirewalls.com
Gaia 4.18 (R82) Immersion Tips, Tricks, & Best Practices Video Course
Now Available at https://shadowpeak.com/gaia4-18-immersion-course
Now Available at https://shadowpeak.com/gaia4-18-immersion-course
- Mark as New
- Bookmark
- Subscribe
- Mute
- Subscribe to RSS Feed
- Permalink
- Report Inappropriate Content
i am running jumbo 70 too, having exactly the same issue. when i run a report for anything over 7 days it hangs, and top command (and the above commands shown by Tim) confirm the Java and java_solr process killing cpu power.
i am running 8 core VM with 32Gb ram. 3 gateway clusters (2 prod, 1 lab).
- Mark as New
- Bookmark
- Subscribe
- Mute
- Subscribe to RSS Feed
- Permalink
- Report Inappropriate Content
Thought i would follow up.
Now running a decided Open server SmartEvent. Split from SMS.
12 core, 32gb physical mem, couple of TB of storage.
It is receviing logs from a couple of logging servers. Its a brand new clean build, so far only has 30gb of logs on the SE (exactly 7 days worth).
And already, its failing to run any reports. over a 1-hour timeframe, it will take about 3min to complete the default report 'network Activity'.
Change the report timeframe to 'last 7 days' and it will hang with spinning wheels. eventually showing a 'failed to parse' error after 30-40minutes. the only way to resolve this i have found is a cpstop/start. (stopping the cpsmead process for example doesnt yeidl good results!)
top -H shows high 'gc slave' processing. i have followed sk123417 to increase the HEAP mem for this. i have doubled and then cubed the max value (2gb - 4gb- 8gb) and the behaviour doesnt change.
CPU's are showing 90%+ for niced processes against ALL 12 cores.
Is anyone else running R80.10 SmartEvent yet?
I now have this identical issue in both a SMS+SE and a standalone SE.
- Mark as New
- Bookmark
- Subscribe
- Mute
- Subscribe to RSS Feed
- Permalink
- Report Inappropriate Content
I am running SmartEvent on R80.10. But we have a distributed architecture. Management server is running on a separate instance with the SmarEvent running on a separate server. The log server+correlation unit are running on another server. I'm not sure if it's the splitting of the functions or something else but so far, we are getting good performance. We do have a lot of logs coming into the log servers as well. Around 40GB per day. May be try splitting the correlation unit?
- Mark as New
- Bookmark
- Subscribe
- Mute
- Subscribe to RSS Feed
- Permalink
- Report Inappropriate Content
Hi. I know this thread is 6 years old, but... How does the management server pick the profile? I ask because we have a dedicated SME server and log server, but our policy manager comes up with this "35800-65535 without SME". How do we tell it we have "35800-65535 with SME or Dedicated Log Server"? Thanks
- Mark as New
- Bookmark
- Subscribe
- Mute
- Subscribe to RSS Feed
- Permalink
- Report Inappropriate Content
You can't tell it which profile to use, it will be automatically determined by the amount of the following resources available at boot (or cprestart), and the role(s) of the system:
1) Total RAM (memory_min & memory_max values)
2) Number of Cores (CPU_NUMBER=X)
3) Whether SmartEvent is enabled and/or the system is configured as a dedicated log server (smart_event (TRUE/FALSE), dedicated_log_server (TRUE/FALSE))
4) If the system is Multi-Domain/Provider-1 (multi_domain (TRUE/FALSE))
5) Whether the system was upgraded or a fresh load (upgrade_setup (TRUE/FALSE))
If you want to encourage it to use a particular profile, you need to make sure the resources/roles that desired profile is looking for are available. The $CPDIR/conf/CpSetupInfo_resourceProfiles.conf file lists all the different profiles and if you review it, it should be possible to figure out what resource/setting you are missing to make it use the profile you want.
It is generally a very bad idea to try to tweak the heap/pool values and number of processes spawned by a particular profile in this configuration file yourself, as you are likely to introduce an imbalance between dependent processes or memory shortage that may reduce performance (or worse).
Gaia 4.18 (R82) Immersion Tips, Tricks, & Best Practices Video Course
Now Available at https://shadowpeak.com/gaia4-18-immersion-course
Now Available at https://shadowpeak.com/gaia4-18-immersion-course
Leaderboard
Epsum factorial non deposit quid pro quo hic escorol.
| User | Count |
|---|---|
| 54 | |
| 41 | |
| 15 | |
| 14 | |
| 12 | |
| 11 | |
| 11 | |
| 11 | |
| 10 | |
| 8 |
Upcoming Events
Thu 19 Feb 2026 @ 03:00 PM (EST)
Americas Deep Dive: Check Point Management API Best PracticesTue 24 Feb 2026 @ 11:00 AM (EST)
Under The Hood: CloudGuard Network Security for Azure Virtual WANThu 19 Feb 2026 @ 03:00 PM (EST)
Americas Deep Dive: Check Point Management API Best PracticesTue 24 Feb 2026 @ 11:00 AM (EST)
Under The Hood: CloudGuard Network Security for Azure Virtual WANAbout CheckMates
Learn Check Point
Advanced Learning
YOU DESERVE THE BEST SECURITY
©1994-2026 Check Point Software Technologies Ltd. All rights reserved.
Copyright
Privacy Policy
About Us
UserCenter