- Products
Quantum
Secure the Network IoT Protect Maestro Management OpenTelemetry/Skyline Remote Access VPN SD-WAN Security Gateways SmartMove Smart-1 Cloud SMB Gateways (Spark) Threat PreventionCloudGuard CloudMates
Secure the Cloud CNAPP Cloud Network Security CloudGuard - WAF CloudMates General Talking Cloud Podcast - Learn
- Local User Groups
- Partners
- More

This website uses Cookies. Click Accept to agree to our website's cookie use as described in our Privacy Policy. Click Preferences to customize your cookie settings.
- Products
- Quantum (Secure the Network)
- CloudGuard CloudMates
- Harmony (Secure the Workspace)
- Infinity Core Services (Collaborative Security Operations & Services)
- Developers
- Check Point Trivia
- CheckMates Toolbox
- General Topics
- Infinity Portal
- Products Announcements
- Threat Prevention Blog
- CheckMates for Startups
- Learn
- Local User Groups
- Upcoming Events
- Americas
- EMEA
- Czech Republic and Slovakia
- Denmark
- Netherlands
- Germany
- Sweden
- United Kingdom and Ireland
- France
- Spain
- Norway
- Ukraine
- Baltics and Finland
- Greece
- Portugal
- Austria
- Kazakhstan and CIS
- Switzerland
- Romania
- Turkey
- Belarus
- Belgium & Luxembourg
- Russia
- Poland
- Georgia
- DACH - Germany, Austria and Switzerland
- Iberia
- Africa
- Adriatics Region
- Eastern Africa
- Israel
- Nordics
- Middle East and Africa
- Balkans
- Italy
- APAC
- Partners
- More
- ABOUT CHECKMATES & FAQ
- Sign In
- Leaderboard
- Events
Secure the GenAI Revolution!
The All-New GenAI Security from Check Point
Transform Your Data Center Management:
The Power of Check Point's MFaaS
Forwarding Events to 3rd-party SIEM
Help us with the Short-Term Roadmap
Mastering Endpoint Security -
Best Practices for 2024
CheckMates Toolbox Contest 2024
Make Your Submission for a Chance to WIN up to $300 Gift Card!
CheckMates Go:
Recently on CheckMtaes
Turn on suggestions
Auto-suggest helps you quickly narrow down your search results by suggesting possible matches as you type.
Showing results for
- CheckMates
- :
- Products
- :
- Quantum
- :
- Management
- :
- Re: MDS R81.20 Performance measures and assessment...
Options
- Subscribe to RSS Feed
- Mark Topic as New
- Mark Topic as Read
- Float this Topic for Current User
- Bookmark
- Subscribe
- Mute
- Printer Friendly Page
Turn on suggestions
Auto-suggest helps you quickly narrow down your search results by suggesting possible matches as you type.
Showing results for
Are you a member of CheckMates?
×
Sign in with your Check Point UserCenter/PartnerMap account to access more great content and get a chance to win some Apple AirPods! If you don't have an account, create one now for free!
- Mark as New
- Bookmark
- Subscribe
- Mute
- Subscribe to RSS Feed
- Permalink
- Report Inappropriate Content
MDS R81.20 Performance measures and assessment of MLM utilization
hi folks,
quick one here
1. how would you measure except DB performance (ps -efw | grep "postgres cpm") how your MDS and MLM behave?
2. is there any technical way to assess whether your MDS and MLM perform as they should or are there any bottlenecks within the infrastructure?
3. how quickly (except use of the famous CCC) we could say that our MDS and MLM are tunned up to the scratch?
3. what would you do yourself when you tasked to seek guidance on "how we could measure the improvement" which came from offloading the MDS CMA's when deploying the MLM with CLM's handling the Logging instead of overloaded CMA's?
3. what would be the 1st and other steps to measure whether your situation improved, benefits and gain some resource relaxation caused by the fact that MDS's CMA's does not handle logs any longer as your CLM's (DLS) now do that instead?
any answer, hints highly appreciate as always.
Cheers!
Jerry
15 Replies
- Mark as New
- Bookmark
- Subscribe
- Mute
- Subscribe to RSS Feed
- Permalink
- Report Inappropriate Content
Hi Jerry,
Have you already performed the change or are you still planning?
Also what operational work flows were suffering?
CCSM R77/R80/ELITE
- Mark as New
- Bookmark
- Subscribe
- Mute
- Subscribe to RSS Feed
- Permalink
- Report Inappropriate Content
hi Chris, thanks for asking. yes it is all done and MDS with MLM are already in place and both works just fine except I'm being tasked to find out what are the real "improvements" and so called "benefits" of having the MLM in place.
So called PoC was to introduce MLM with CLM's to offload the MDS CMA's from the "logging" fwwk's processes however, Customer is still keen to know exactly what is the measured benefit knowing that CMA's operates quicker, indeed but not visibly so much better hence we're concerned whether the deployment of the MLM brings desired difference to the performance of the MDS.
Hope that clarifies the matter, if not please let me know.
Jerry
- Mark as New
- Bookmark
- Subscribe
- Mute
- Subscribe to RSS Feed
- Permalink
- Report Inappropriate Content
Hi,
1-2. Sorry I'm less familiar with ps -efw | grep "postgres cpm"or how much does it affect performance for MDS/MLM but I suggest a few things to check if you have bottlenecks: a. Check "top" or "cpview" for both servers and monitor CPU and memory consumption. b. Check if you have a delay on logs arrival. If the newest logs are more than a few seconds old, you might have a bottleneck. If you check on log file instead of regular mode it might differ since when opening log file you see the logs even if they're not indexed. If they appear on the log file and not on the regular logs view bottleneck might be in the indexer.
3. Should be very quick but if you have network components between them they should be taken to consideration. When you connect them it will restart so speed also depends on hardware. Anyway the logs should come directly from GWs to MLM, from MDS it would probably be more DB related changes which are much less frequent and in volume. If you have a delay I would check speed between GWs to MLM.
3. If you want to measure improvements I would compare the time to perform same actions. You can see if you have improvement in policy installation time, publish (of similar objects), any speed improvement while using SmartConsole etc.
3. I would suggest monitoring recommendations from previous steps: top/cpview for hardware consumption, time to complete management operation etc.
Kind regards, Amir Senn
- Mark as New
- Bookmark
- Subscribe
- Mute
- Subscribe to RSS Feed
- Permalink
- Report Inappropriate Content
Thanks Amir, answering in sequence of your questions:
1. policy installation is minorily improved hence the whole concerns about the MLM sense in general
2. global policy re-assignments - massively improved - so that is a GOOD factor
3. top and cpview as well as ccc is one thing, but measured differences is another, still wonder how to measure considering nature of the CLM/MLM deliveries
3. there is no SMART-1 hardware - it's all on VMWare VM's except Gateways.
Cheers
Jerry
- Mark as New
- Bookmark
- Subscribe
- Mute
- Subscribe to RSS Feed
- Permalink
- Report Inappropriate Content
What metrics / outputs do you have from the former setup for the basis of comparison.
Do you have old cpinfos or anything like that from which to extract data?
Additionally in terms of baseline how much of sk104848 has been adopted.
CCSM R77/R80/ELITE
- Mark as New
- Bookmark
- Subscribe
- Mute
- Subscribe to RSS Feed
- Permalink
- Report Inappropriate Content
Thanks Chris
yes I've got an old cpinfo on hand however time is absolutely crucial here hence such research with cpinfo old debug's etc. is most likely not the approach I'm after.
I was just wondering despite mentioned sk104848 what else we can find out within gaia itself to identify any potential bottleneck's or orther "slows down" on the MDS-MLM relationship pattern considering that network parts are out of scope (all within the same vSwitch and vCenter farm).
Cheers
Jerry
- Mark as New
- Bookmark
- Subscribe
- Mute
- Subscribe to RSS Feed
- Permalink
- Report Inappropriate Content
Understood, however we are missing a lot of information / variables that would be useful in providing further guidance without a detailed investigation.
Have you looked over HCP or CPM Doctor outputs already for the nodes?
CCSM R77/R80/ELITE
- Mark as New
- Bookmark
- Subscribe
- Mute
- Subscribe to RSS Feed
- Permalink
- Report Inappropriate Content
Thanks Chris I do appreciate it.
HCP raport is done + CPM doc is one of the first things I do when look at the perf. data.
I've just completed the ccc stuff research and found that multi_cpu is not "tweaked" on that MDS in question, also Dynamic_Split is NOT enabled wonder if that would boost some benefits on that MDS, in essense having MDS with half-tera RAM and 5TB storage for 30 domains isn't easy to tune/tweak really. Lots of factors and lots of question marks despite variables Chris which may or may not posses some risk when look at from the wrong angle.
Jerry
- Mark as New
- Bookmark
- Subscribe
- Mute
- Subscribe to RSS Feed
- Permalink
- Report Inappropriate Content
Dynamic split is applicable only to Gateway appliances (sk164155).
CCSM R77/R80/ELITE
- Mark as New
- Bookmark
- Subscribe
- Mute
- Subscribe to RSS Feed
- Permalink
- Report Inappropriate Content
- Mark as New
- Bookmark
- Subscribe
- Mute
- Subscribe to RSS Feed
- Permalink
- Report Inappropriate Content
also some of the data for your @Chris_Atkinson
clish -c "show asset system"
Platform: VMware Virtual Platform
CPU Model: Intel(R) Xeon(R) Gold 6252 CPU
CPU Frequency: 2095.077 Mhz
Number of Cores: 64
CPU Hyperthreading: Disabled
cat /sys/devices/system/cpu/smt/active
0
psql_client cpm postgres -c "SELECT pg_size_pretty(pg_database_size('cpm'));"
pg_size_pretty
----------------
11 GB
(1 row)
ps. just running HCP again, let's see if that differs from the CPMdoc
Jerry
- Mark as New
- Bookmark
- Subscribe
- Mute
- Subscribe to RSS Feed
- Permalink
- Report Inappropriate Content
I'm not seeing any advice in support of SMT / Hyper Threading for Management applications.
Historically it wasn't recommended for Smart-1 appliances (sk104788), that said I've not confirmed the state on newer hardware by comparison.
What is it about the current CPU load distribution that makes you think this would be advantageous vs the changes recommended in sk104848 for example?
CCSM R77/R80/ELITE
- Mark as New
- Bookmark
- Subscribe
- Mute
- Subscribe to RSS Feed
- Permalink
- Report Inappropriate Content
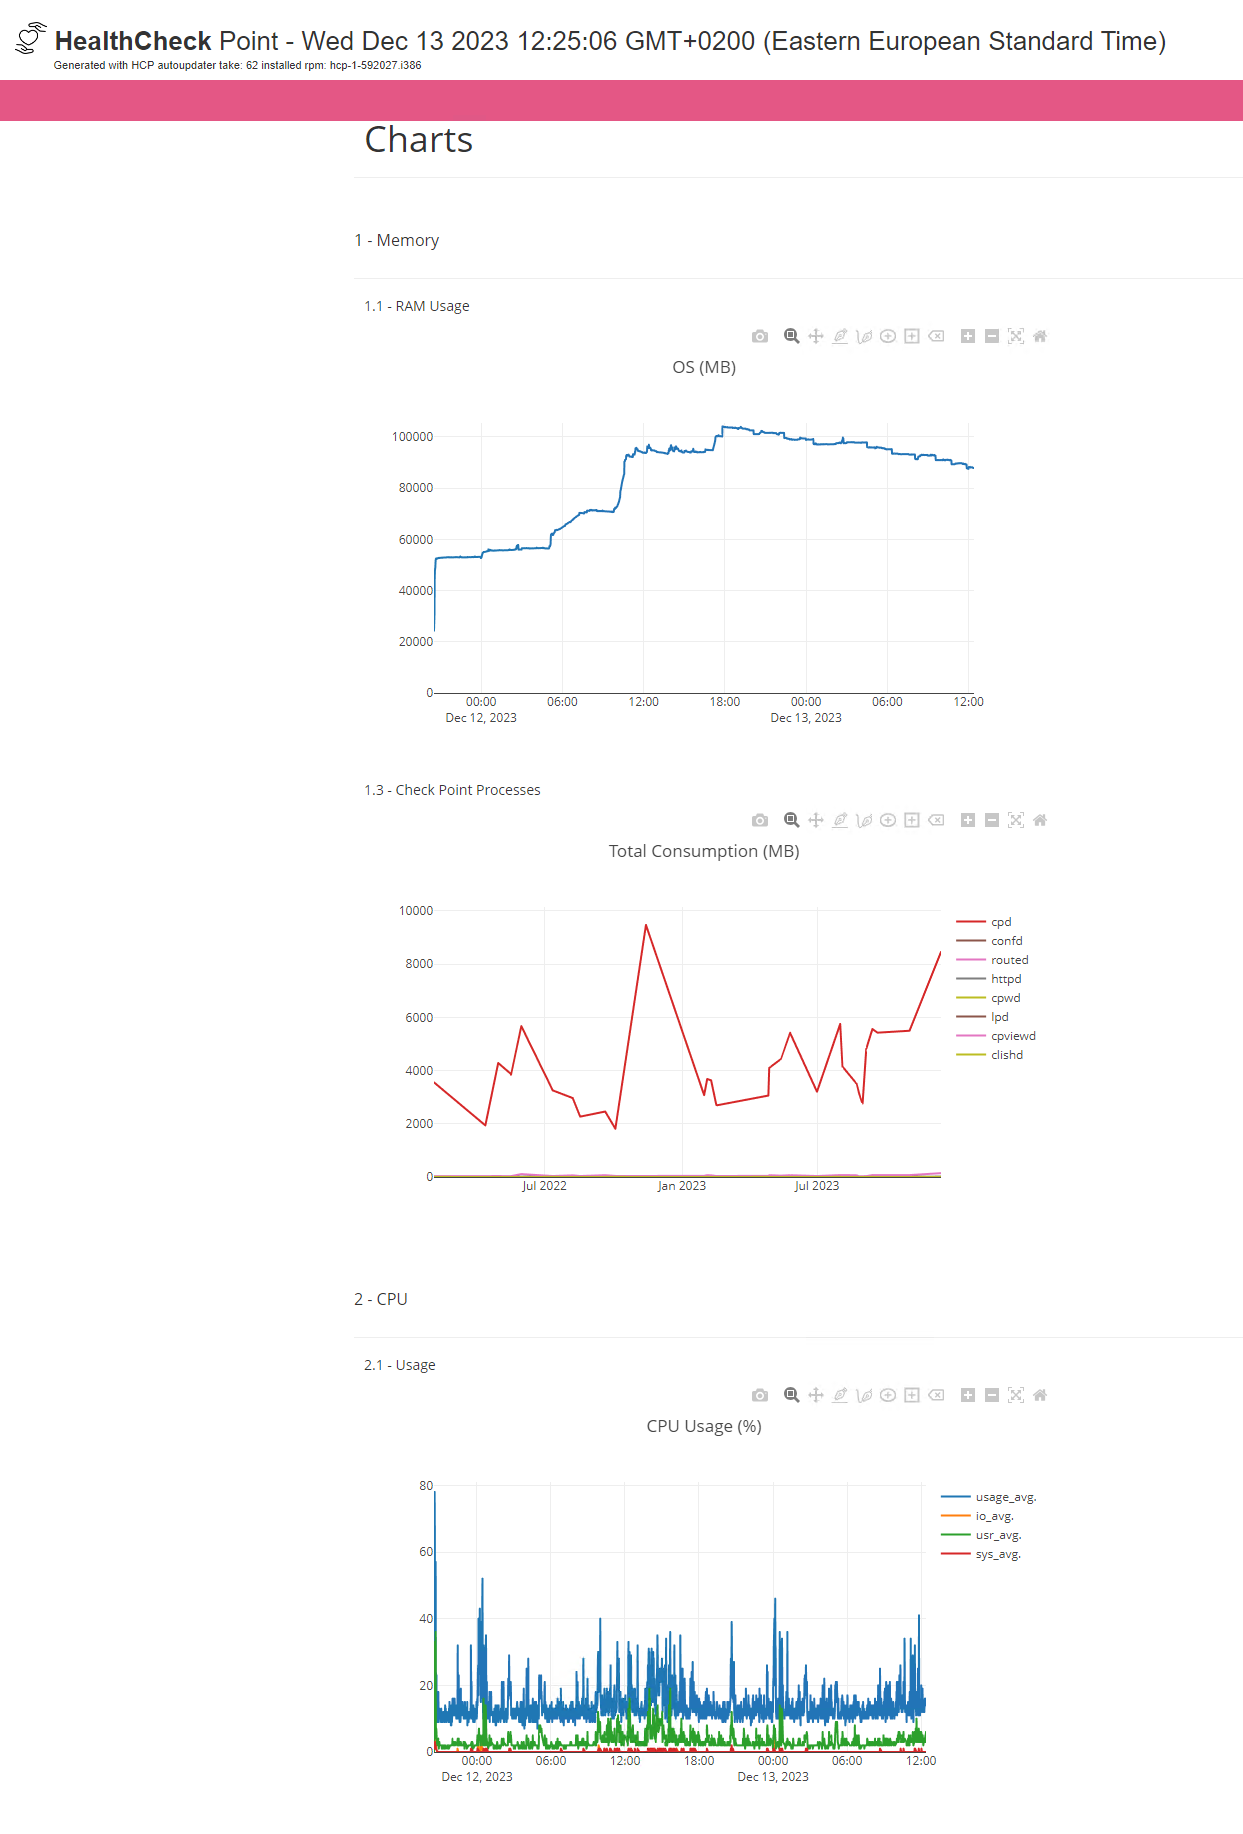
[Executing:]# hcp -r all
Test name Status
============================================================
Gaia DB...........................................[PASSED]
ARP Cache Limit...................................[PASSED]
Software Version..................................[PASSED]
Core Dumps........................................[PASSED]
ICA expiration....................................[PASSED]
Interface Errors..................................[PASSED]
Disk Space........................................[WARNING]
File Descriptors..................................[PASSED]
Kernel crash......................................[PASSED]
Local Address Port Usage..........................[PASSED]
Hardware Compatibility............................[PASSED]
SYSLOG timestamp..................................[PASSED]
Memory Usage......................................[WARNING]
Blocker handlers check............................[PASSED]
User space processes affinity check...............[PASSED]
Bond - Traffic distribution.......................[SKIPPED]
Static affinity...................................[PASSED]
Connectivity to UC................................[PASSED]
SIC...............................................[PASSED]
Implied Rules.....................................[ERROR]
Zombie processes..................................[WARNING]
Soft lockup.......................................[PASSED]
Generating Topology...............................[Done]
Generating Story..................................[Done]
Generating Charts.................................[Done]
Failed tests:
Test name Status Runtime (sec)
==========================================================================
Disk Space........................................[WARNING] 0.00523
Memory Usage......................................[WARNING] 5.73936
Implied Rules.....................................[ERROR] 0.00007
Zombie processes..................................[WARNING] 0.03769
+------------------------------------------------------------------------------------------------------------------------------------+
| Results |
+====================================================================================================================================+
| Gaia OS/General/Disk Space |
+------------------------------------------------------------------------------------------------------------------------------------+
| Result: WARNING |
| |
| Description: This test verifies that disk space usage is in the normal threshold on all file systems. |
| |
| Summary: Detected file systems which are above thresholds: |
| |
| +------------------------------------------------------------------------------------+ |
| | Disk File Systems | |
| +---------------------------------+------------+-----------+--------+----------------+ |
| | Filesystem | Used | Available | Used % | Mounted on | |
| +=================================+============+===========+========+================+ |
| | /dev/mapper/vg_splat-lv_current | 87.00 GB | 117.90 GB | 43% | / | |
| +---------------------------------+------------+-----------+--------+----------------+ |
| | /dev/sda1 | 0.07 GB | 0.20 GB | 28% | /boot | |
| +---------------------------------+------------+-----------+--------+----------------+ |
| | tmpfs | 0.14 GB | 251.82 GB | 1% | /dev/shm | |
| +---------------------------------+------------+-----------+--------+----------------+ |
| | /dev/mapper/vg_splat-lv_log | 4140.79 GB | 859.20 GB | 83% | /var/log | |
| +---------------------------------+------------+-----------+--------+----------------+ |
| | cgroup | 0.00 GB | 251.96 GB | 0% | /sys/fs/cgroup | |
| +---------------------------------+------------+-----------+--------+----------------+ |
| |
| |
| |
| Finding: |
| File system [/dev/mapper/vg_splat-lv_log] crossed the warning threshold [70%] |
| |
| Suggested solutions: |
| - Clean up unnecessary files from the file system. For more details refer sk60080. |
| - Please contact Check Point Support for further assistance in case the issue persists. |
| |
+------------------------------------------------------------------------------------------------------------------------------------+
| Gaia OS/Memory/Memory Usage |
+------------------------------------------------------------------------------------------------------------------------------------+
| Result: WARNING |
| |
| Description: This test verifies if memory usage (RAM) crossed threshold of 85%, and verifies additional thresholds for the |
| different sections. |
| |
| Summary: |
| +----------------------------------------+ |
| | Memory Overview | |
| +--------------+-----------+-------------+ |
| | Key | Value (%) | Value (MiB) | |
| +==============+===========+=============+ |
| | Used Memory | 17.04% | 87922.57 | |
| +--------------+-----------+-------------+ |
| | Free Memory | 82.96% | 428084.05 | |
| +--------------+-----------+-------------+ |
| | Total Memory | 100.00% | 516006.62 | |
| +--------------+-----------+-------------+ |
| |
| |
| The overview table presents the system overall memory usage. |
| |
| +--------------------------------------+ |
| | Swap Status | |
| +------------+-----------+-------------+ |
| | Key | Value (%) | Value (MiB) | |
| +============+===========+=============+ |
| | Used Swap | 0.00% | 0.00 | |
| +------------+-----------+-------------+ |
| | Total Swap | 100% | 32765.38 | |
| +------------+-----------+-------------+ |
| |
| |
| The swap table presents the swap usage. |
| |
| +--------------------------------------------+ |
| | Used Memory Sections | |
| +------------------+-----------+-------------+ |
| | Key | Value (%) | Value (MiB) | |
| +==================+===========+=============+ |
| | Kernel | 1.68% | 1477.70 | |
| +------------------+-----------+-------------+ |
| | User space (PSS) | 97.67% | 85876.29 | |
| +------------------+-----------+-------------+ |
| | Other | 0.65% | 568.58 | |
| +------------------+-----------+-------------+ |
| |
| |
| The used memory sections table shows how much memory each section takes. |
| For user space details refer to 'top user space processes' table. |
| For kernel details refer to Kernel Sections table below. |
| |
| +-----------------------------------------------------------+ |
| | Kernel Sections | |
| +---------+-----------+-------------+-----------------------+ |
| | Key | Value (%) | Value (MiB) | Users | |
| +=========+===========+=============+=======================+ |
| | Vmalloc | 64.85% | 958.35 | | |
| +---------+-----------+-------------+-----------------------+ |
| | Slabs | 35.15% | 519.35 | See 'Top Slabs' table | |
| +---------+-----------+-------------+-----------------------+ |
| |
| |
| The kernel sections table details on the different kernel allocation types and their size. |
| |
| +-----------------------------------------------------------+ |
| | Top Slabs | |
| +------------------+-------------+----------+---------------+ |
| | Name | Value (MiB) | Objects | Total Objects | |
| +==================+=============+==========+===============+ |
| | xfs_inode | 680.50 | 743071 | 743284 | |
| +------------------+-------------+----------+---------------+ |
| | proc_inode_cache | 52.15 | 80372 | 82350 | |
| +------------------+-------------+----------+---------------+ |
| | dentry | 376.83 | 2056516 | 2058000 | |
| +------------------+-------------+----------+---------------+ |
| | buffer_head | 4607.24 | 46439106 | 46452353 | |
| +------------------+-------------+----------+---------------+ |
| | radix_tree_node | 572.40 | 1041927 | 1042027 | |
| +------------------+-------------+----------+---------------+ |
| |
| |
| The top slabs table helps to determine top slab cache objects usage. |
| |
| +----------------------------------------------------------------------------------------------------------------------+ |
| | Top user-space processes (per pid) | |
| +----+---------+-----------------------------------------------------------------------+-------+-----------+-----------+ |
| | VS | Process | Command | PID | RAM used | Swap used | |
| +====+=========+=======================================================================+=======+===========+===========+ |
| | 0 | java | /opt/CPshrd-R81.20/jre_64/bin/java -D_solr=TRUE | 15538 | 42.3 GiB | 0.0 KiB | |
| | | | -Xdump:directory=/var/log/dump/usermode -Xdump:heap:events=gpf+user | | | | |
| | | | -Xdump:tool:none -Xdump:tool:events=gpf+abort+traceassert+corruptcach | | | | |
| | | | e,priority=1,range=1..0,exec=javaCompress.sh solr %pid -Xdump:tool:ev | | | | |
| | | | ents=systhrow,filter=java/lang/OutOfMemoryError,priority=1,range=1..0 | | | | |
| | | | ,exec=javaCompress.sh solr %pid | | | | |
| | | | -Xdump:tool:events=throw,filter=java/lang/OutOfMemoryError,exec=kill | | | | |
| | | | -9 %pid -Xaggressive -Xshareclasses:none | | | | |
| | | | -Xgc:scvTenureAge=1,noAdaptiveTenure -server -Xmx131334m | | | | |
| | | | -Dlog4j2.formatMsgNoLookups=true -Xms256m | | | | |
| | | | -Dorg.terracotta.quartz.skipUpdateCheck=true -Xdump:system:none | | | | |
| | | | -Djetty.base=/opt/CPrt-R81.20/rfl_server/jetty_base | | | | |
| | | | -Djetty.home=/opt/CPsuite-R81.20/fw1/Solr7 | | | | |
| | | | -Dlog4j.configurationFile=file:/opt/CPrt-R81.20/conf/solr_log4j2.xml | | | | |
| | | | -Dsolr.log.dir=/opt/CPrt-R81.20/log | | | | |
| | | | -Dsolr.install.dir=/opt/CPsuite-R81.20/fw1/Solr7 -DSTOP.PORT=7210 | | | | |
| | | | -DSTOP.KEY=log_infra -Dsolr.disable.shardsWhitelist=true -jar | | | | |
| | | | /opt/CPsuite-R81.20/fw1/Solr7/start.jar --module=https --lib=/opt/CPr | | | | |
| | | | t-R81.20/jars/aspectjrt-1.8.9.jar:/opt/CPrt-R81.20/jars/cxf-codegen- | | | | |
| | | | plugin-3.1.18.jar:/opt/CPrt-R81.20/jars/cxf- | | | | |
| | | | core-3.1.18.jar:/opt/CPrt-R81.20/jars/cxf-java2ws- | | | | |
| | | | plugin-3.1.18.jar:/opt/CPrt-R81.20/jars/cxf-rt-bindings- | | | | |
| | | | soap-3.1.18.jar:/opt/CPrt-R81.20/jars/cxf-rt-bindings- | | | | |
| | | | xml-3.1.18.jar:/opt/CPrt-R81.20/jars/cxf-rt-databinding- | | | | |
| | | | aegis-3.1.18.jar:/opt/CPrt-R81.20/jars/cxf-rt-databinding- | | | | |
| | | | jaxb-3.1.18.jar:/opt/CPrt-R81.20/jars/cxf-rt-frontend- | | | | |
| | | | jaxws-3.1.18.jar:/opt/CPrt-R81.20/jars/cxf-rt-frontend- | | | | |
| | | | simple-3.1.18.jar:/opt/CPrt-R81.20/jars/cxf-rt- | | | | |
| | | | javascript-3.1.18.jar:/opt/CPrt-R81.20/jars/cxf-rt-transports- | | | | |
| | | | http-3.1.18.jar:/opt/CPrt-R81.20/jars/cxf-rt-transports-http- | | | | |
| | | | jetty-3.1.18.jar:/opt/CPrt-R81.20/jars/cxf-rt-ws- | | | | |
| | | | addr-3.1.18.jar:/opt/CPrt-R81.20/jars/cxf-rt-ws- | | | | |
| | | | policy-3.1.18.jar:/opt/CPrt-R81.20/jars/cxf-rt- | | | | |
| | | | wsdl-3.1.18.jar:/opt/CPrt-R81.20/jars/cxf-tools- | | | | |
| | | | common-3.1.18.jar:/opt/CPrt-R81.20/jars/cxf-tools- | | | | |
| | | | java2ws-3.1.18.jar:/opt/CPrt-R81.20/jars/cxf-tools- | | | | |
| | | | validator-3.1.18.jar:/opt/CPrt-R81.20/jars/cxf-tools-wsdlto- | | | | |
| | | | core-3.1.18.jar:/opt/CPrt-R81.20/jars/cxf-tools-wsdlto-databinding- | | | | |
| | | | jaxb-3.1.18.jar:/opt/CPrt-R81.20/jars/cxf-tools-wsdlto-frontend-jaxws | | | | |
| | | | -3.1.18.jar:/opt/CPrt-R81.20/jars/java_is.jar:/opt/CPrt-R81.20/jars/j | | | | |
| | | | ava_sic.jar:/opt/CPrt-R81.20/jars/jaxb- | | | | |
| | | | core-2.2.7.jar:/opt/CPrt-R81.20/jars/jaxb- | | | | |
| | | | impl-2.2.7.jar:/opt/CPrt-R81.20/jars/jaxb-xjc-2.2.5.jar:/opt/CPrt-R81 | | | | |
| | | | .20/jars/jetty_assist.jar:/opt/CPrt-R81.20/jars/neethi-3.0.3.jar:/opt | | | | |
| | | | /CPrt-R81.20/jars/wsdl4j-1.6.3.jar:/opt/CPrt-R81.20/jars/xmlschema- | | | | |
| | | | core-2.2.1.jar:/opt/CPsuite-R81.20/fw1/Solr7/solr-webapp/webapp/WEB- | | | | |
| | | | INF/lib/* | | | | |
| +----+---------+-----------------------------------------------------------------------+-------+-----------+-----------+ |
| | 0 | java | /opt/CPshrd-R81.20/jre_64/bin/java -D_CPM=TRUE -Xaot:forceaot | 15251 | 4.3 GiB | 0.0 KiB | |
| | | | -Xmx51200m -Xms192m -Xgcpolicy:optavgpause | | | | |
| | | | -Dlog4j2.configurationFile=/opt/CPsuite-R81.20/fw1/conf/log4j2.xml | | | | |
| | | | -Djava.io.tmpdir=/opt/CPsuite-R81.20/fw1/tmp -Xaggressive | | | | |
| | | | -Xshareclasses:none | | | | |
| | | | -Djava.security.krb5.conf=/opt/CPsuite-R81.20/fw1/conf/krb5.conf -Xji | | | | |
| | | | t:exclude={com/checkpoint/management/dleserver/coresvc/internal/Schem | | | | |
| | | | aMgrSvcImpl.getClassInfo*},exclude={com/checkpoint/management/object_ | | | | |
| | | | store/ObjectStoreSessionImpl.findFieldsBySearchQueryEx*},exclude={org | | | | |
| | | | /eclipse/persistence/mappings/AggregateCollectionMapping.compareForCh | | | | |
| | | | ange*} -Xdump:directory=/var/log/dump/usermode | | | | |
| | | | -Xdump:heap:events=gpf+user -Xdump:tool:none | | | | |
| | | | -Xdump:tool:events=user,priority=1,range=1..0,exec=javaCompress.sh | | | | |
| | | | CPMUSER %pid -Xdump:tool:events=gpf+abort+traceassert+corruptcache,pr | | | | |
| | | | iority=1,range=1..0,exec=javaCompress.sh CPM %pid -Xdump:tool:events= | | | | |
| | | | systhrow,filter=java/lang/OutOfMemoryError,priority=1,range=1..0,exec | | | | |
| | | | =javaCompress.sh CPM %pid -Xdump:tool:events=throw,filter=java/lang/O | | | | |
| | | | utOfMemoryError,priority=1,exec=kill -9 %pid -Dfile.encoding=UTF-8 | | | | |
| | | | -cp *: com.checkpoint.management.cpm.Cpm -s | | | | |
| +----+---------+-----------------------------------------------------------------------+-------+-----------+-----------+ |
| | 0 | fwm | fwm mds | 55409 | 778.5 MiB | 0.0 KiB | |
| | | | | | | | |
| +----+---------+-----------------------------------------------------------------------+-------+-----------+-----------+ |
| | 0 | java | /opt/CPshrd-R81.20/jre_64/bin/java -D_smartview=TRUE | 15689 | 755.6 MiB | 0.0 KiB | |
| | | | -Xdump:directory=/var/log/dump/usermode -Xdump:heap:events=gpf+user | | | | |
| | | | -Xdump:tool:none -Xdump:tool:events=gpf+abort+traceassert+corruptcach | | | | |
| | | | e,priority=1,range=1..0,exec=javaCompress.sh smartview %pid -Xdump:to | | | | |
| | | | ol:events=systhrow,filter=java/lang/OutOfMemoryError,priority=1,range | | | | |
| | | | =1..0,exec=javaCompress.sh smartview %pid | | | | |
| | | | -Xdump:tool:events=throw,filter=java/lang/OutOfMemoryError,exec=kill | | | | |
| | | | -9 %pid -Xaggressive -Xshareclasses:none | | | | |
| | | | -Xgc:scvTenureAge=1,noAdaptiveTenure -Xmx2048m -Xms512m | | | | |
| | | | -Djava.io.tmpdir=/opt/CPrt-R81.20/tmp -Dfile.encoding=UTF-8 | | | | |
| | | | -DDedicatedServer=false -DIsMLM=false -DTaskExecThreads=4 -Dlog4j.con | | | | |
| | | | figuration=file:/opt/CPrt-R81.20/conf/smartview.log4j.properties | | | | |
| | | | -Dorg.terracotta.quartz.skipUpdateCheck=true -DRTDIR=/opt/CPrt-R81.20 | | | | |
| | | | -Dpath=/opt/CPrt-R81.20/jars/aspectjrt-1.8.9.jar:/opt/CPrt-R81.20/jar | | | | |
| | | | s/commons-io-1.3.2.jar:/opt/CPrt-R81.20/jars/commons- | | | | |
| | | | io-2.5.jar:/opt/CPrt-R81.20/jars/commons- | | | | |
| | | | lang-2.6.jar:/opt/CPrt-R81.20/jars/cxf-codegen- | | | | |
| | | | plugin-3.1.18.jar:/opt/CPrt-R81.20/jars/cxf- | | | | |
| | | | core-3.1.18.jar:/opt/CPrt-R81.20/jars/cxf-java2ws- | | | | |
| | | | plugin-3.1.18.jar:/opt/CPrt-R81.20/jars/cxf-rt-bindings- | | | | |
| | | | soap-3.1.18.jar:/opt/CPrt-R81.20/jars/cxf-rt-bindings- | | | | |
| | | | xml-3.1.18.jar:/opt/CPrt-R81.20/jars/cxf-rt-databinding- | | | | |
| | | | aegis-3.1.18.jar:/opt/CPrt-R81.20/jars/cxf-rt-databinding- | | | | |
| | | | jaxb-3.1.18.jar:/opt/CPrt-R81.20/jars/cxf-rt-frontend- | | | | |
| | | | jaxws-3.1.18.jar:/opt/CPrt-R81.20/jars/cxf-rt-frontend- | | | | |
| | | | simple-3.1.18.jar:/opt/CPrt-R81.20/jars/cxf-rt- | | | | |
| | | | javascript-3.1.18.jar:/opt/CPrt-R81.20/jars/cxf-rt-transports- | | | | |
| | | | http-3.1.18.jar:/opt/CPrt-R81.20/jars/cxf-rt-transports-http- | | | | |
| | | | jetty-3.1.18.jar:/opt/CPrt-R81.20/jars/cxf-rt-ws- | | | | |
| | | | addr-3.1.18.jar:/opt/CPrt-R81.20/jars/cxf-rt-ws- | | | | |
| | | | policy-3.1.18.jar:/opt/CPrt-R81.20/jars/cxf-rt- | | | | |
| | | | wsdl-3.1.18.jar:/opt/CPrt-R81.20/jars/cxf-tools- | | | | |
| | | | common-3.1.18.jar:/opt/CPrt-R81.20/jars/cxf-tools- | | | | |
| | | | java2ws-3.1.18.jar:/opt/CPrt-R81.20/jars/cxf-tools- | | | | |
| | | | validator-3.1.18.jar:/opt/CPrt-R81.20/jars/cxf-tools-wsdlto- | | | | |
| | | | core-3.1.18.jar:/opt/CPrt-R81.20/jars/cxf-tools-wsdlto-databinding- | | | | |
| | | | jaxb-3.1.18.jar:/opt/CPrt-R81.20/jars/cxf-tools-wsdlto-frontend-jaxws | | | | |
| | | | -3.1.18.jar:/opt/CPrt-R81.20/jars/java_is.jar:/opt/CPrt-R81.20/jars/j | | | | |
| | | | ava_sic.jar:/opt/CPrt-R81.20/jars/jaxb- | | | | |
| | | | core-2.2.7.jar:/opt/CPrt-R81.20/jars/jaxb- | | | | |
| | | | impl-2.2.7.jar:/opt/CPrt-R81.20/jars/jaxb-xjc-2.2.5.jar:/opt/CPrt-R81 | | | | |
| | | | .20/jars/neethi-3.0.3.jar:/opt/CPrt-R81.20/jars/rfl_sic.jar:/opt/CPrt | | | | |
| | | | -R81.20/jars/smartview-jetty.jar:/opt/CPrt-R81.20/jars/woodstox-core- | | | | |
| | | | asl-4.2.0.jar:/opt/CPrt-R81.20/jars/wsdl4j-1.6.3.jar:/opt/CPrt-R81.20 | | | | |
| | | | /jars/xmlschema-core-2.2.1.jar: -DSTOP.PORT=8079 -DSTOP.KEY=smartview | | | | |
| | | | -jar start.jar OPTIONS=Server,resources,websocket | | | | |
| | | | /opt/CPrt-R81.20/conf/smartview-jetty.xml | | | | |
| | | | /opt/CPrt-R81.20/conf/smartview-service-jetty.xml | | | | |
| +----+---------+-----------------------------------------------------------------------+-------+-----------+-----------+ |
| | 0 | java | /opt/CPshrd-R81.20/jre_64/bin/java -D_RFL=TRUE | 15630 | 688.4 MiB | 0.0 KiB | |
| | | | -Xdump:directory=/var/log/dump/usermode -Xdump:heap:events=gpf+user | | | | |
| | | | -Xdump:tool:none -Xdump:tool:events=gpf+abort+traceassert+corruptcach | | | | |
| | | | e,priority=1,range=1..0,exec=javaCompress.sh RFL %pid -Xdump:tool:eve | | | | |
| | | | nts=systhrow,filter=java/lang/OutOfMemoryError,priority=1,range=1..0, | | | | |
| | | | exec=javaCompress.sh RFL %pid | | | | |
| | | | -Xdump:tool:events=throw,filter=java/lang/OutOfMemoryError,exec=kill | | | | |
| | | | -9 %pid -Xaggressive -Xshareclasses:none | | | | |
| | | | -Xgc:scvTenureAge=1,noAdaptiveTenure -Xmx2048m -Xms96m | | | | |
| | | | -Dorg.terracotta.quartz.skipUpdateCheck=true -Dupgrade.cores.count= | | | | |
| | | | -Dfile.encoding=UTF-8 | | | | |
| | | | -DreportingServer.conf.dir=/opt/CPrt-R81.20/conf | | | | |
| | | | -Dlog4j.configuration=file:/opt/CPrt-R81.20/conf/rfl.log4j.properties | | | | |
| | | | -DReportingServer.log=/opt/CPrt-R81.20/log -cp | | | | |
| | | | /opt/CPrt-R81.20/jars/* com.checkpoint.core.LogCore -type jms | | | | |
| +----+---------+-----------------------------------------------------------------------+-------+-----------+-----------+ |
| |
| |
| The top user space table helps to determine which process consumes high memory. |
| |
| +----------------------------------------------------------------------------------------------------------------------+ |
| | Top user-space processes (aggregated by name) | |
| +-------------+----------------+----------------------------------------------------------------+----------+-----------+ |
| | Process | # of processes | Command | RAM used | Swap used | |
| +=============+================+================================================================+==========+===========+ |
| | java | 7 | /opt/CPshrd-R81.20/jre_64/bin/java -D_solr=TRUE | 48.4 GiB | 0.0 KiB | |
| | | | -Xdump:directory=/var/log/dump/usermode | | | |
| | | | -Xdump:heap:events=gpf+user -Xdump:tool:none -Xdump:tool:event | | | |
| | | | s=gpf+abort+traceassert+corruptcache,priority=1,ra | | | |
| +-------------+----------------+----------------------------------------------------------------+----------+-----------+ |
| | fwm | 32 | fwm mds | 8.8 GiB | 0.0 KiB | |
| +-------------+----------------+----------------------------------------------------------------+----------+-----------+ |
| | cpd | 32 | /opt/CPmds-R81.20/customers/Betologic_Management_Server/CPshrd | 8.3 GiB | 0.0 KiB | |
| | | | -R81.20/bin/cpd | | | |
| +-------------+----------------+----------------------------------------------------------------+----------+-----------+ |
| | log_indexer | 32 | /opt/CPmds-R81.20/customers/EuroLiveTech_Management_Server/CPr | 7.6 GiB | 0.0 KiB | |
| | | | t-R81.20/log_indexer/log_indexer -workingDir /opt/CPmds-R81.20 | | | |
| | | | /customers/EuroLiveTech_Management_Server/CPrt-R81.20/log_inde | | | |
| | | | xer/ | | | |
| +-------------+----------------+----------------------------------------------------------------+----------+-----------+ |
| | postgres | 33 | postgres: postgres cpm 127.0.0.1(51046) idle | 4.1 GiB | 0.0 KiB | |
| +-------------+----------------+----------------------------------------------------------------+----------+-----------+ |
| |
| |
| The top user space by name table helps to determine which process name consumes high memory. |
| |
| |
| Summary: |
| Detected thresholds which have been crossed. |
| |
| Finding: |
| Failure: Process java memory consumption is higher than 3000 MiB. |
| |
| Finding: |
| Failure: Process java memory consumption is higher than 3000 MiB. |
| |
| |
+------------------------------------------------------------------------------------------------------------------------------------+
| Firewall/Configuration/Implied Rules |
+------------------------------------------------------------------------------------------------------------------------------------+
| Result: ERROR |
| |
| Description: Check the integrity of the implied rules file. |
| |
| Summary: /opt/CPmds-R81.20/lib/implied_rules.def cannot be found |
| |
| |
+------------------------------------------------------------------------------------------------------------------------------------+
| System/General/Zombie processes |
+------------------------------------------------------------------------------------------------------------------------------------+
| Result: WARNING |
| |
| Description: This test checks if zombie (defunct) processes exists. |
| |
| Summary: Found 1 processes in defunct state |
| |
| Finding: |
| |
| +-----------------------------------------------+ |
| | Zombie processes | |
| +-------+---------+------------+----------------+ |
| | PID | Command | Parent PID | Parent Command | |
| +=======+=========+============+================+ |
| | 27876 | httpd2 | 12728 | httpd2 | |
| +-------+---------+------------+----------------+ |
| |
| Suggested solutions: |
| - Please submit a service request to Check Point Support and provide the table displayed in the summary for further |
| investigation. |
| |
+------------------------------------------------------------------------------------------------------------------------------------+
Jerry
- Mark as New
- Bookmark
- Subscribe
- Mute
- Subscribe to RSS Feed
- Permalink
- Report Inappropriate Content
Could be you're installing policy using the accelerated method so it might be less noticeable. How is the general responsiveness of the server feels?
The question is, why did you moved to MLM? Did MLM installation solved the issue?
MLM can address different issues - from more storage space for logs due to retention needs, adding redundancy, lowering stress from MGMT etc. Everyone can use it for different reasons.
Kind regards, Amir Senn
- Mark as New
- Bookmark
- Subscribe
- Mute
- Subscribe to RSS Feed
- Permalink
- Report Inappropriate Content
hi Amir long story short:
1. MLM was developed and deployed in order to save MDS CMA's resourcing constrains and performance issues my Customer was facing, each CMA was logging to itself one cluster plus some of the CMA's were overloaded heavily by fw_log processing so much that Customer decided to consolidate logging within the MLM which so far has 5 but will have over 30 domains (DLS/CLM)
2. MLM solved the issues so far but the improvement over the MDS offsite logging via CLM's was not so significant, ie. Global Re-Assignments and Global policies push is much quicker and this is visibly much better than with each CMA logging to itself but overall those CMA's offloaded from logging has minor round 10-15% of power rectified, no more (so far!)
3. MLM was about to answer complex but ultimately simple questions - can we give our MDS HA environment some air to breath as the performance of the MDS was so much degraded over the years wit 30 CMA's and each having at least 1 Cluster. That was improved 2 ways in parallel: 1 - MLM for 5 most "logging" domains, 2 - MDS re-power (more RAM, more CORE etc.)
- both did the job and so far my improvements on that environment works well, Customer is kind of settled and happy with the way it work but concerned that 5 domains did not show such SIGNIFICANT improvements they've been counting on, although I'm working and will be working next year on more "blending" solutions as well as delivering all remaining DLS's onto the MLM which on the Take 41 recently "installed" works IMHO like a charm 🙂
Cheers and Merry X-Mass everyone who celebrate it!
Jerry
Leaderboard
Epsum factorial non deposit quid pro quo hic escorol.
| User | Count |
|---|---|
| 12 | |
| 4 | |
| 3 | |
| 3 | |
| 2 | |
| 2 | |
| 2 | |
| 2 | |
| 2 | |
| 1 |
Upcoming Events
Wed 04 Sep 2024 @ 05:00 PM (CEST)
Secure the GenAI Revolution with the All-New GenAI Security from Check PointThu 05 Sep 2024 @ 11:00 AM (PDT)
West US: What's New In Check Point Quantum Security Gateway R82!Wed 04 Sep 2024 @ 05:00 PM (CEST)
Secure the GenAI Revolution with the All-New GenAI Security from Check PointThu 05 Sep 2024 @ 11:00 AM (PDT)
West US: What's New In Check Point Quantum Security Gateway R82!Tue 10 Sep 2024 @ 03:00 PM (AEST)
No Suits, No Ties - MDR and Incident Response - Going Equipped to Compromise (APAC)Tue 10 Sep 2024 @ 10:00 AM (CEST)
No Suits, No Ties - MDR and Incident Response - Going Equipped to Compromise (EMEA)Tue 10 Sep 2024 @ 05:00 PM (CEST)
No Suits, No Ties - MDR and Incident Response - Going Equipped to Compromise (Americas)Wed 11 Sep 2024 @ 10:00 AM (CEST)
CheckMates Live Norway - Network Troubleshooting Best PracticesTue 01 Oct 2024 @ 10:00 AM (CEST)
CheckMates Live Salzburg - Maintenance and Upgrade Best PracticesThu 03 Oct 2024 @ 10:00 AM (CEST)
CheckMates Live Vienna - Identity Awareness Best Practices and Harmony Sase UpdatesAbout CheckMates
Learn Check Point
Advanced Learning
YOU DESERVE THE BEST SECURITY
©1994-2024 Check Point Software Technologies Ltd. All rights reserved.
Copyright
Privacy Policy
About Us
UserCenter