- Products
Network & SASE IoT Protect Maestro Management OpenTelemetry/Skyline Remote Access VPN SASE SD-WAN Security Gateways SmartMove Smart-1 Cloud SMB Gateways (Spark) Threat PreventionCloud Cloud Network Security CloudMates General CloudGuard - WAF Talking Cloud Podcast Weekly ReportsSecurity Operations Events External Risk Management Incident Response Infinity AI Infinity Portal NDR Playblocks SOC XDR/XPR Threat Exposure Management
- Learn
- Local User Groups
- Partners
- More

This website uses Cookies. Click Accept to agree to our website's cookie use as described in our Privacy Policy. Click Preferences to customize your cookie settings.
- Products
- AI Security
- Developers & More
- Check Point Trivia
- CheckMates Toolbox
- General Topics
- Products Announcements
- Threat Prevention Blog
- Upcoming Events
- Americas
- EMEA
- Czech Republic and Slovakia
- Denmark
- Netherlands
- Germany
- Sweden
- United Kingdom and Ireland
- France
- Spain
- Norway
- Ukraine
- Baltics and Finland
- Greece
- Portugal
- Austria
- Kazakhstan and CIS
- Switzerland
- Romania
- Turkey
- Belarus
- Belgium & Luxembourg
- Russia
- Poland
- Georgia
- DACH - Germany, Austria and Switzerland
- Iberia
- Africa
- Adriatics Region
- Eastern Africa
- Israel
- Nordics
- Middle East and Africa
- Balkans
- Italy
- Bulgaria
- Cyprus
- APAC
AI Security Masters
E1: How AI is Reshaping Our World
MVP 2026: Submissions
Are Now Open!
What's New in R82.10?
Watch NowOverlap in Security Validation
Help us to understand your needs better
CheckMates Go:
Maestro Madness
Turn on suggestions
Auto-suggest helps you quickly narrow down your search results by suggesting possible matches as you type.
Showing results for
- CheckMates
- :
- Products
- :
- Network & SASE
- :
- Management
- :
- How to monitor bandwidth limit for application con...
Options
- Subscribe to RSS Feed
- Mark Topic as New
- Mark Topic as Read
- Float this Topic for Current User
- Bookmark
- Subscribe
- Mute
- Printer Friendly Page
Turn on suggestions
Auto-suggest helps you quickly narrow down your search results by suggesting possible matches as you type.
Showing results for
Are you a member of CheckMates?
×
Sign in with your Check Point UserCenter/PartnerMap account to access more great content and get a chance to win some Apple AirPods! If you don't have an account, create one now for free!
- Mark as New
- Bookmark
- Subscribe
- Mute
- Subscribe to RSS Feed
- Permalink
- Report Inappropriate Content
How to monitor bandwidth limit for application control
Hi
Anyone can advice. How to monitor bandwidth limit for application control ?
MGMT R80.10
GW R77.30
15 Replies
- Mark as New
- Bookmark
- Subscribe
- Mute
- Subscribe to RSS Feed
- Permalink
- Report Inappropriate Content
SmartEvent Views is what you are looking for.

- Mark as New
- Bookmark
- Subscribe
- Mute
- Subscribe to RSS Feed
- Permalink
- Report Inappropriate Content
Hi Danny
Thank you for your advice but I would like to see real time utilize or exceed drop for limit policy when user complain about slow access.
- Mark as New
- Bookmark
- Subscribe
- Mute
- Subscribe to RSS Feed
- Permalink
- Report Inappropriate Content
Hi all,
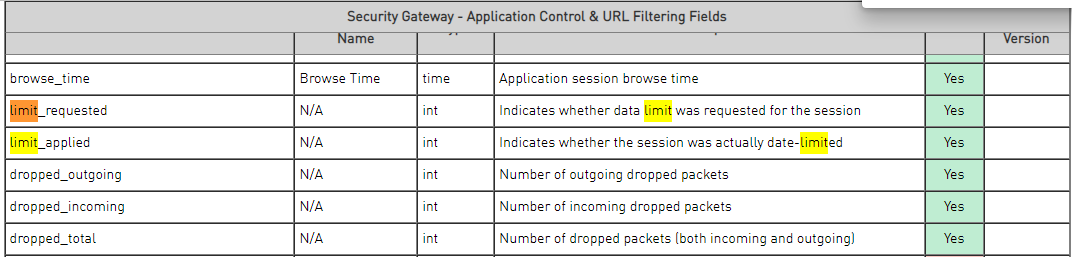
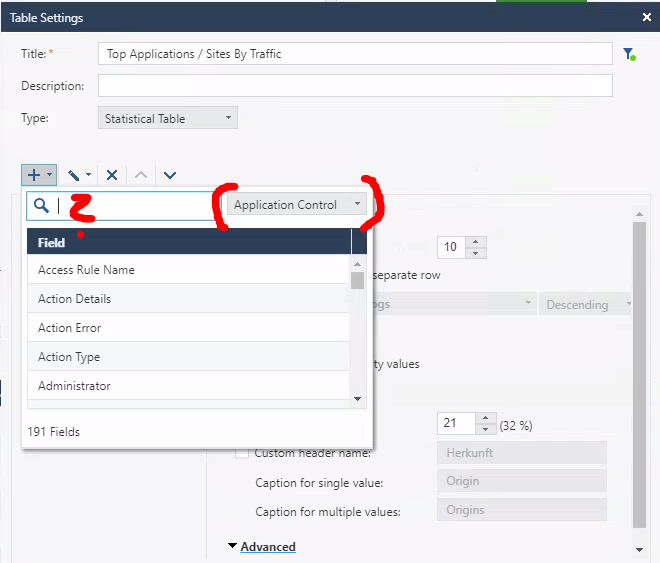
after a long time for that question i would like to ask if someone found a real solution . I have the same question and tried to figure out the possibility with a view from Logs&Monitor page. The problem ist that i found based on sk144192 the table fields for limit_request, limit_applied, etc. but i cant choose it within the table settings of the view. The table fields were indexed but no name that i can search for. Any hint would be helpfully.
- Mark as New
- Bookmark
- Subscribe
- Mute
- Subscribe to RSS Feed
- Permalink
- Report Inappropriate Content
SmartEvent can only create reports on fields that are directly indexed.
These fields are not, presumably, which is why they can't be specified for reports.
Sometimes, specific fields can be enabled through an RFE with your local Check Point office.
- Mark as New
- Bookmark
- Subscribe
- Mute
- Subscribe to RSS Feed
- Permalink
- Report Inappropriate Content
Hello again, thanks for the quick response. I will go back to our customer with that information and will discuss it maybe with our Channel Partner SE. Thanks and have a nice day.
- Mark as New
- Bookmark
- Subscribe
- Mute
- Subscribe to RSS Feed
- Permalink
- Report Inappropriate Content
Note - The Security Gateway implements the Limit action by dropping successive packets which exceed the allowed bandwidth.
How to monitor exceed drop ? I have no see this log from SmartConsole.
- Mark as New
- Bookmark
- Subscribe
- Mute
- Subscribe to RSS Feed
- Permalink
- Report Inappropriate Content
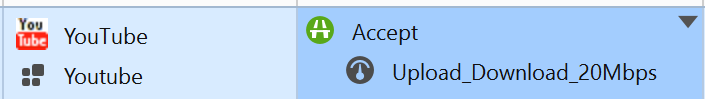
Then you want to use SmartLog like this:

- Mark as New
- Bookmark
- Subscribe
- Mute
- Subscribe to RSS Feed
- Permalink
- Report Inappropriate Content
I do not get any results when using the filter, "bandwidth AND appi_name:YouTube". However I do get results if use the filter, "bandwidth" by itself or "appi_name:YouTube" by itself.
I am very interested in getting the results like the screen shot from Kosin.
- Mark as New
- Bookmark
- Subscribe
- Mute
- Subscribe to RSS Feed
- Permalink
- Report Inappropriate Content
Bandwidth management by dropping packets is a bad strategy. You can get much better results by changing (reducing) window sizes in responses and holding back acknowledgement packets.
Nothing gets dropped but you let the TCP protocol do the bandwidth limiting.
Not somethink I invented. Companies like PacketShaper (bought by Blue Coat, bought in turn by Symantec) did create great appliances with features like this.
<< We make miracles happen while you wait. The impossible jobs take just a wee bit longer. >>
- Mark as New
- Bookmark
- Subscribe
- Mute
- Subscribe to RSS Feed
- Permalink
- Report Inappropriate Content
Thank you Danny. Now I can see drop log from smartview for bandwidth limit policy.

- Mark as New
- Bookmark
- Subscribe
- Mute
- Subscribe to RSS Feed
- Permalink
- Report Inappropriate Content
hi
i have the same question as you.
Could you please guide me on how to get those statistics as you did?
thanks
- Mark as New
- Bookmark
- Subscribe
- Mute
- Subscribe to RSS Feed
- Permalink
- Report Inappropriate Content
Hi,
are you able to provide any additonal details as to how you got this report?
Thanks
- Mark as New
- Bookmark
- Subscribe
- Mute
- Subscribe to RSS Feed
- Permalink
- Report Inappropriate Content
When researching my book I dug into the APCL Limit feature, trying to find a way to disable APCL limits "on the fly" for testing purposes or to monitor real-time statistics for packets dropped due to a Limit. The goal was to ensure an enforced Limit was not the cause of poor performance. Other than the statistics that are included in the traffic logs as demonstrated by Danny Jung above, there isn't a direct way to do that. I also discovered that APCL/URLF cannot be disabled "on the fly" like Threat Prevention can with fw amw unload.
However fw ctl zdebug drop will show real-time packet drops due to an APCL limit with the message: PSL Drop: APPI_LIMIT.
Also watch out for this issue when limits are applied to traffic subject to HTTPS Inspection:
--
Second Edition of my "Max Power" Firewall Book
Now Available at http://www.maxpowerfirewalls.com
Gaia 4.18 (R82) Immersion Tips, Tricks, & Best Practices Video Course
Now Available at https://shadowpeak.com/gaia4-18-immersion-course
Now Available at https://shadowpeak.com/gaia4-18-immersion-course
- Mark as New
- Bookmark
- Subscribe
- Mute
- Subscribe to RSS Feed
- Permalink
- Report Inappropriate Content
@Timothy_Hall doesn't sk70600 only apply to R75.40? Or does it apply to the R80 trains as well?
- Mark as New
- Bookmark
- Subscribe
- Mute
- Subscribe to RSS Feed
- Permalink
- Report Inappropriate Content
The cpas_tcp_do_sack variable still exists in the R80.40 kernel and its default value is 1. If I'm reading the SK correctly you only need to flip this variable if the two hosts are using very large TCP windows and packet loss is present. There were a ton of changes to CPAS (R80.20) and TLS Inspection (R80.30) so this variable may not even be relevant anymore.
Gaia 4.18 (R82) Immersion Tips, Tricks, & Best Practices Video Course
Now Available at https://shadowpeak.com/gaia4-18-immersion-course
Now Available at https://shadowpeak.com/gaia4-18-immersion-course
Leaderboard
Epsum factorial non deposit quid pro quo hic escorol.
| User | Count |
|---|---|
| 17 | |
| 15 | |
| 8 | |
| 5 | |
| 5 | |
| 5 | |
| 4 | |
| 4 | |
| 4 | |
| 4 |
Upcoming Events
Thu 18 Dec 2025 @ 10:00 AM (CET)
Cloud Architect Series - Building a Hybrid Mesh Security Strategy across cloudsThu 08 Jan 2026 @ 05:00 PM (CET)
AI Security Masters Session 1: How AI is Reshaping Our WorldThu 18 Dec 2025 @ 10:00 AM (CET)
Cloud Architect Series - Building a Hybrid Mesh Security Strategy across cloudsThu 08 Jan 2026 @ 05:00 PM (CET)
AI Security Masters Session 1: How AI is Reshaping Our WorldAbout CheckMates
Learn Check Point
Advanced Learning
YOU DESERVE THE BEST SECURITY
©1994-2025 Check Point Software Technologies Ltd. All rights reserved.
Copyright
Privacy Policy
About Us
UserCenter