- Products
Network & SASE IoT Protect Maestro Management OpenTelemetry/Skyline Remote Access VPN SASE SD-WAN Security Gateways SmartMove Smart-1 Cloud SMB Gateways (Spark) Threat PreventionCloud Cloud Network Security CloudMates General CloudGuard - WAF Talking Cloud Podcast Weekly ReportsSecurity Operations Events External Risk Management Incident Response Infinity AI Infinity Portal NDR Playblocks SOC XDR/XPR Threat Exposure Management
- Learn
- Local User Groups
- Partners
- More
This website uses Cookies. Click Accept to agree to our website's cookie use as described in our Privacy Policy. Click Preferences to customize your cookie settings.
- Products
- AI Security
- Developers & More
- Check Point Trivia
- CheckMates Toolbox
- General Topics
- Products Announcements
- Threat Prevention Blog
- Upcoming Events
- Americas
- EMEA
- Czech Republic and Slovakia
- Denmark
- Netherlands
- Germany
- Sweden
- United Kingdom and Ireland
- France
- Spain
- Norway
- Ukraine
- Baltics and Finland
- Greece
- Portugal
- Austria
- Kazakhstan and CIS
- Switzerland
- Romania
- Turkey
- Belarus
- Belgium & Luxembourg
- Russia
- Poland
- Georgia
- DACH - Germany, Austria and Switzerland
- Iberia
- Africa
- Adriatics Region
- Eastern Africa
- Israel
- Nordics
- Middle East and Africa
- Balkans
- Italy
- Bulgaria
- Cyprus
- APAC
CheckMates Fest 2026
Join the Celebration!
AI Security Masters
E1: How AI is Reshaping Our World
MVP 2026: Submissions
Are Now Open!
What's New in R82.10?
Watch NowOverlap in Security Validation
Help us to understand your needs better
CheckMates Go:
Maestro Madness
Turn on suggestions
Auto-suggest helps you quickly narrow down your search results by suggesting possible matches as you type.
Showing results for
- CheckMates
- :
- Products
- :
- Network & SASE
- :
- Management
- :
- Re: Entries in log/messages
Options
- Subscribe to RSS Feed
- Mark Topic as New
- Mark Topic as Read
- Float this Topic for Current User
- Bookmark
- Subscribe
- Mute
- Printer Friendly Page
Turn on suggestions
Auto-suggest helps you quickly narrow down your search results by suggesting possible matches as you type.
Showing results for
Are you a member of CheckMates?
×
Sign in with your Check Point UserCenter/PartnerMap account to access more great content and get a chance to win some Apple AirPods! If you don't have an account, create one now for free!
- Mark as New
- Bookmark
- Subscribe
- Mute
- Subscribe to RSS Feed
- Permalink
- Report Inappropriate Content
Entries in log/messages
Hello all,
I was checking /var/log/messages from the active node (Check Point R80.10 Cluster in Open Server - Take 154) and I found these entries; please can you help me to understand what they means and address the investigation:
1. kernel: [fw4_0];fwmultik_dispatch_inbound: instance mismatch (on connection <IP Address>(80) -> <IP Address> (9307) IPP 6): predefined says 2 lookup says 0)
2. kernel: [fw4_0];fwpslglue_do_log: Log buffer is full
3. kernel: [fw4_1];FW-1: Starting CUL mode because CPU usage (81%) on the local member increased above the configured threshold (80%).
4. kernel: [fw4_0];FW-1: SIM (SecureXL Implementation Module) SecureXL device detected.
kernel: [fw4_1];fwioctl: Policy has ended. Continuing extending dead timouts (fwha_cul_policy_done_time=8522491)
I also notices the $FWDIR/log/fw.log is unreadable:

Is that a normal behavior ? I don't think so...
Any useful information is really appreciated.
Thank you very much,
Luca
Labels
- Labels:
-
Logging
- Tags:
- r80.10
8 Replies
- Mark as New
- Bookmark
- Subscribe
- Mute
- Subscribe to RSS Feed
- Permalink
- Report Inappropriate Content
SK113398 looks like the problem you may be having. If it is, this issue was fixed and is part of the JHF take 142 or higher for R80.10.
As for the unreable fw.log file, that is definitely not normal. If you are seeing logs appear in SmartLog, it could just be a view issue. You may try to do a manual log switch and see if that corrects it. If not, then I would call into TAC.
- Mark as New
- Bookmark
- Subscribe
- Mute
- Subscribe to RSS Feed
- Permalink
- Report Inappropriate Content
Hello Matt,
thank you for your reply, as reported initially, we already have Take 154 installed:
# cpinfo -y all
This is Check Point CPinfo Build 914000190 for GAIA
[IDA]
HOTFIX_R80_10
[CPFC]
HOTFIX_R80_10
HOTFIX_R80_10_JUMBO_HF Take: 154
[FW1]
HOTFIX_R80_10
HOTFIX_R80_10_JUMBO_HF Take: 154
FW1 build number:
This is Check Point's software version R80.10 - Build 124
kernel: R80.10 - Build 001
[SecurePlatform]
HOTFIX_R80_10_JUMBO_HF Take: 154
[CPinfo]
No hotfixes..
[PPACK]
HOTFIX_R80_10
HOTFIX_R80_10_JUMBO_HF Take: 154
[DIAG]
HOTFIX_R80_10
[CVPN]
HOTFIX_R80_10
HOTFIX_R80_10_JUMBO_HF Take: 154
[CPUpdates]
BUNDLE_CPINFO Take: 0
BUNDLE_R80_10_JUMBO_HF_SC Take: 83
BUNDLE_R80_10_JUMBO_HF Take: 154
Regarding fw.log...I'll try your solution.
Thank you,
Luca
- Mark as New
- Bookmark
- Subscribe
- Mute
- Subscribe to RSS Feed
- Permalink
- Report Inappropriate Content
Hello Luca,
The fw.log is binary file and can be opened by CPLogFilePrint only. For it just perform the “CPLogFilePrint $FWDIR/log/fw.log” command under expert mode.
Tell me please, which CPUs usage do you see on the members? You can see this information in the CPView.
Regards,
Dmitry Krupnik
- Mark as New
- Bookmark
- Subscribe
- Mute
- Subscribe to RSS Feed
- Permalink
- Report Inappropriate Content
Hello Dmitry,
first of all, the "CPLogFilePrint $FWDIR/log/fw.log" worked fine, thank you.
Now, regarding the point 3: kernel: [fw4_1];FW-1: Starting CUL mode because CPU usage (81%) on the local member increased above the configured threshold (80%).
The entry appears when there is an high CPU usage (one of three fw_worker_<nn> process consumes about 70%, 80%, 85% and 90% percentage).
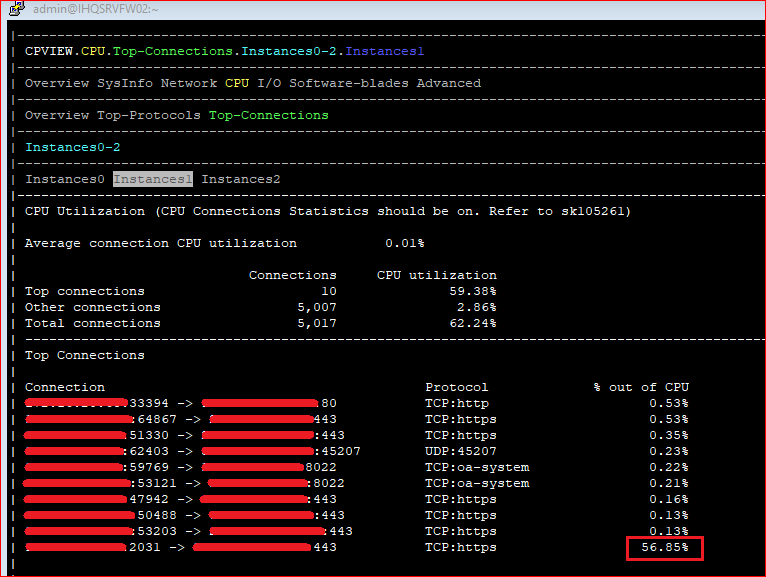
Casually I reproduced the issue: I was downloading a Windows 10 iso file from my client PC, then I noticed a 57% CPU usage (see screenshot below).
We have HTTPs Inspection and Application & URL Filtering enabled; Application & URL Filtering is enabled for ALL; however HTTPs Inspection is in ByPass for ALL, with the exception of my client computer where it was set to Inspect (because I'm testing HTTPs inspection before applying it to all users).
How is possible a simple file download from one client will use a lot of that CPU ? Do you think it is due to limited CPU license we are just using in our Check Point ?
Regarding the other points, I'll give you more information asap.
Thank you,
Luca

- Mark as New
- Bookmark
- Subscribe
- Mute
- Subscribe to RSS Feed
- Permalink
- Report Inappropriate Content
Hello Luca,
According to logs:
1) "fwmultik_dispatch_inbound: instance mismatch". I have asked the RnD owners about this log. If you see any impact, I suggest to open request in the TAC
2) "fwpslglue_do_log: Log buffer is full" First of all make sure, that logging works in the default mode, perform the "fw ctl debug 0" command under expert mode. After it take a look the sk52100
3) "Starting CUL mode because CPU usage (81%)". This log means, that Cluster Under Load (CUL) mechanism works as expected. Question, that important to understand - why your appliance has high CPU load and how often it happens. If I understand correctly generally the CPU usage of your GW exists in the allowable range, but during some downloads the usage greatly increases. I will strive to discover this question internally, but won't be able to provide ETA. If you see any impact, I suggest to open request in the TAC.
4) "SIM (SecureXL Implementation Module)" - for me it looks like general SecureXL log, I don't think that you need to worry about this message.
Regards,
Dmitry
- Mark as New
- Bookmark
- Subscribe
- Mute
- Subscribe to RSS Feed
- Permalink
- Report Inappropriate Content
When was CPLogFilePrint added?
Didn't realize that command was present.
- Mark as New
- Bookmark
- Subscribe
- Mute
- Subscribe to RSS Feed
- Permalink
- Report Inappropriate Content
This tool exist since R80.10. I am discussing with RnD creating SK, which will describe it.
- Mark as New
- Bookmark
- Subscribe
- Mute
- Subscribe to RSS Feed
- Permalink
- Report Inappropriate Content
Excellent, looking forward to seeing it ![]()
CPLogFilePrint seems to provide more details than fw log, which has been around since at least FireWall-1 version 2 ![]()
Leaderboard
Epsum factorial non deposit quid pro quo hic escorol.
| User | Count |
|---|---|
| 22 | |
| 13 | |
| 13 | |
| 6 | |
| 5 | |
| 5 | |
| 5 | |
| 4 | |
| 4 | |
| 4 |
Upcoming Events
Thu 08 Jan 2026 @ 05:00 PM (CET)
AI Security Masters Session 1: How AI is Reshaping Our WorldThu 22 Jan 2026 @ 05:00 PM (CET)
AI Security Masters Session 2: Hacking with AI: The Dark Side of InnovationThu 12 Feb 2026 @ 05:00 PM (CET)
AI Security Masters Session 3: Exposing AI Vulnerabilities: CP<R> Latest Security FindingsThu 26 Feb 2026 @ 05:00 PM (CET)
AI Security Masters Session 4: Powering Prevention: The AI Driving Check Point’s ThreatCloudThu 08 Jan 2026 @ 05:00 PM (CET)
AI Security Masters Session 1: How AI is Reshaping Our WorldThu 22 Jan 2026 @ 05:00 PM (CET)
AI Security Masters Session 2: Hacking with AI: The Dark Side of InnovationThu 26 Feb 2026 @ 05:00 PM (CET)
AI Security Masters Session 4: Powering Prevention: The AI Driving Check Point’s ThreatCloudAbout CheckMates
Learn Check Point
Advanced Learning
YOU DESERVE THE BEST SECURITY
©1994-2025 Check Point Software Technologies Ltd. All rights reserved.
Copyright
Privacy Policy
About Us
UserCenter


