Hello,
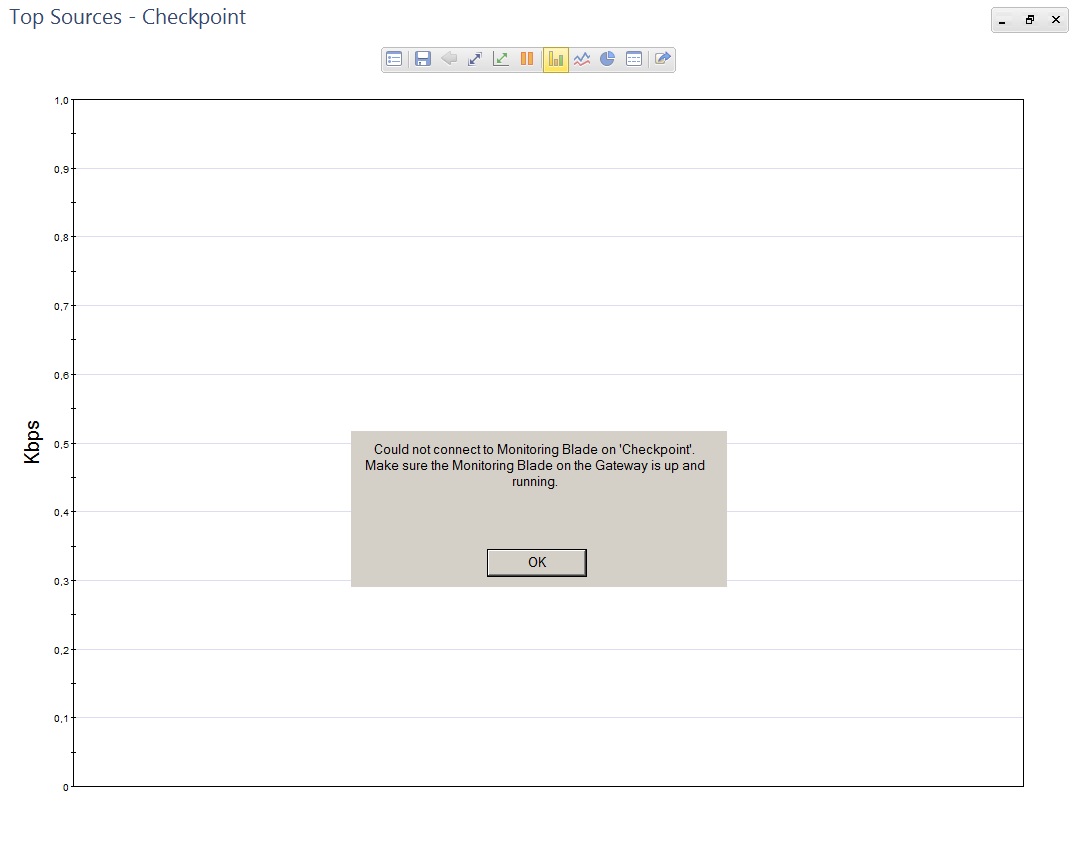
I have this error when I try to view "top" statistics in SmartView Monitor:
Could not connect to Monitoring Blade. Make sure the Monitoring Blade on the Gateway is up and running.

Monitoring Blade is active. I have valid evaluation license for Monitoring.
I tried to disable the Monitoring blade, install policy, enable the Monitoring blade, install policy. Also tried "cpstop && cpstart". When I entered "rtmstop && rtmstart":
[expert] rtmstop && rtmstart
Stopping SmartView Monitor daemon ...
SmartView Monitor daemon is not running
Stopping SmartView Monitor kernel ...
Driver 2 is already down
Driver 3 is already down
Driver 4 is already down
Driver 5 is already down
SmartView Monitor kernel stopped
SmartView Monitor: Loading kernel ...
CKP: Loading SVM Instance 0: [ OK ]
CKP: Loading SVM Instance 1: [ OK ]
Starting SmartView Monitor kernel ...
SmartView Monitor: Driver 2 is Down, Can't turn it on.
Starting SmartView Monitor daemon
[expert] rtm drv stat
SmartView Monitor: Driver 0 is Off
SmartView Monitor: Driver 1 is Off
SmartView Monitor: Driver 2 is Down
SmartView Monitor: Driver 3 is Down
SmartView Monitor: Driver 4 is Down
SmartView Monitor: Driver 5 is Down
[expert] rtm drv on
SmartView Monitor: Driver 2 is Down, Can't turn it on.
[expert] rtm stat
-------------------------------------------------------
SmartView Monitor Status: Mon Sep 25 16:11:15 2017
-------------------------------------------------------
Product is Enabled
Daemon is OFF
-------------------------------------------------------
Status for kernel instance 0
-------------------------------------------------------
Driver is OFF
Open Views: 0
-------------------------------------------------------
Status for kernel instance 1
-------------------------------------------------------
Driver is OFF
Open Views: 0
-------------------------------------------------------
Status for kernel instance 2
-------------------------------------------------------
Driver is Down
-------------------------------------------------------
Status for kernel instance 3
-------------------------------------------------------
Driver is Down
-------------------------------------------------------
Status for kernel instance 4
-------------------------------------------------------
Driver is Down
-------------------------------------------------------
Status for kernel instance 5
-------------------------------------------------------
Driver is Down
[expert] rtm rtmd
[24223][25 Sep 16:07:51] Unable to open '/dev/rtm2': No such file or directory
[24223][25 Sep 16:07:51] E2E device (/dev/rtm2) open failed: No such file or directory
[expert] ls -la /dev/rtm*
crw-r--r-- 1 admin root 239, 0 Sep 25 16:06 /dev/rtm0
crw-r--r-- 1 admin root 238, 0 Sep 25 16:06 /dev/rtm1
It is standalone installation as a Virtual Machine in VMware ESXi 6.5. The VM has 2x Intel Xeon X5550 @ 2.67GHz CPU, 16GB RAM, 300GB HDD.
Does anybody know how to fix this?
Thank you


