- Products
- Learn
- Local User Groups
- Partners
- More

This website uses Cookies. Click Accept to agree to our website's cookie use as described in our Privacy Policy. Click Preferences to customize your cookie settings.
- Products
- Learn
- Local User Groups
- Upcoming Events
- Americas
- EMEA
- Czech Republic and Slovakia
- Denmark
- Netherlands
- Germany
- Sweden
- United Kingdom and Ireland
- France
- Spain
- Norway
- Ukraine
- Baltics and Finland
- Greece
- Portugal
- Austria
- Kazakhstan and CIS
- Switzerland
- Romania
- Turkey
- Belarus
- Belgium & Luxembourg
- Russia
- Poland
- Georgia
- DACH - Germany, Austria and Switzerland
- Iberia
- Africa
- Adriatics Region
- Eastern Africa
- Israel
- Nordics
- Middle East and Africa
- Balkans
- Italy
- Bulgaria
- Cyprus
- APAC
- Partners
- More
- ABOUT CHECKMATES & FAQ
- Sign In
- Leaderboard
- Events
On-Premises SD-WAN Management
Register HereThe industry's first AI Network Firewall
Securing AI traffic, everywhere
AI Security Masters E8:
Claude Mythos: New Era in Cyber Security
CheckMates Go:
No Attack Required
Turn on suggestions
Auto-suggest helps you quickly narrow down your search results by suggesting possible matches as you type.
Showing results for
- CheckMates
- :
- Products
- :
- General Topics
- :
- Re: [tool] - https://tcpdump101.com
Options
- Subscribe to RSS Feed
- Mark Topic as New
- Mark Topic as Read
- Float this Topic for Current User
- Bookmark
- Subscribe
- Mute
- Printer Friendly Page
Turn on suggestions
Auto-suggest helps you quickly narrow down your search results by suggesting possible matches as you type.
Showing results for
Are you a member of CheckMates?
×
Sign in with your Check Point UserCenter/PartnerMap account to access more great content and get a chance to win some Apple AirPods! If you don't have an account, create one now for free!
- Mark as New
- Bookmark
- Subscribe
- Mute
- Subscribe to RSS Feed
- Permalink
- Report Inappropriate Content
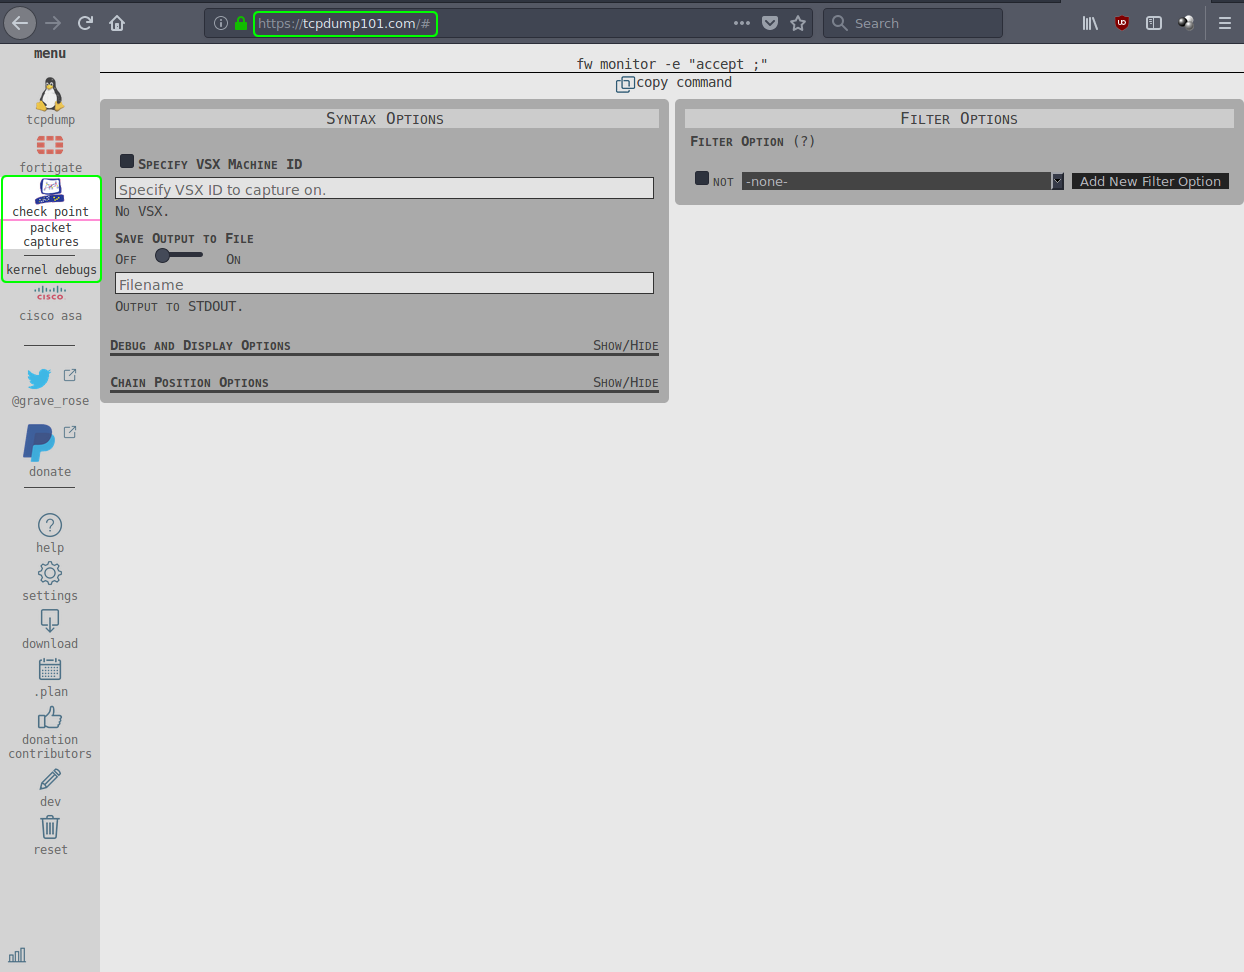
[tool] - https://tcpdump101.com
Hopefully self-promotion isn't frowned upon but I was suggested to post here. Over the past few years, I've been working on a tool to help people capture packets by allowing users to have a web-based interface to create the commands for them. Today, I've launched the latest version into production which supports "fw monitor" as well as "fw ctl debug" commands. It's located here: https://tcpdump101.com
I'm posting this in the hopes that people will find it useful (it supports tcpdump as well as other vendors) and maybe get some feedback from the community. If you use it, let me know if you find it handy, what you'd like to see improved and if you have any other suggestions.
Thanks,
Sean (Gr@ve_Rose)
84 Replies
- Mark as New
- Bookmark
- Subscribe
- Mute
- Subscribe to RSS Feed
- Permalink
- Report Inappropriate Content
You're epic, Marco! ::high-five:: Thanks for the kind words. ![]()
- Mark as New
- Bookmark
- Subscribe
- Mute
- Subscribe to RSS Feed
- Permalink
- Report Inappropriate Content
Man I love it! Great job.
Regarding kernel debug there is some bug, when you disable all debugs from FW module you get this command.
fw ctl debug 0
fw ctl debug -buf 50
fw ctl debug -t info -f commonfw ctl debug -m fw - error warning cookie crypt domain ex driver filter hold if install ioctl kbuf ld log machine memory misc packet q xlate xltrc conn synatk media sip vm chain bridge tcpstr scv highavail ipv6 packval sync ipopt link nat cifs drop route citrix misp portscan leaks mgcp sock mail spii chainfwd msnms wire balance dynlog smtp wap content mrtsync sam sock malware cmi aspii dos advp multik netquota monitor monitorall dfilter integrity epq cvpnd cptls ftp nac span ucd acct dlp ua icmptun dnstun ips rad te zeco user shmem utest qos context prof connstats nat64 ntup event cgnat sctp
fw ctl kdebug -t -o debug -f
And no FW module for debugging is active, or I dont know what kind of syntax is this "fw ctl debug -m fw - error"
- Mark as New
- Bookmark
- Subscribe
- Mute
- Subscribe to RSS Feed
- Permalink
- Report Inappropriate Content
Thanks for the kind reply. It's actually not a bug - Let me explain:
When performing "fw ctl debug" and making modifications to the module flags (in your example, the "fw" module) you can either add flags (with the + sign) or you can remove flags (with the - sign). Each of these actions (add and remove module flags) must be on their own line which is why we have one line for "fw ctl debug -m $MODULE + $FLAGS" and "fw ctl debug -m $MODULE - $FLAGS)". On each line, you can have as many of the modules turned on or off as you want.
When programming this, the easiest way I found to create these lines was to create an array of the modules (the boxes on the right) and whether or not they were "active" or "inactive". Taking this array, we loop over all the entries and put the specific module flags in their respective line (either "+" or "-") which then updates the command.
The downside to this is that there's no baseline array to compare against so even if you set your debug flags back to their original settings, the commands still appear - It works but it does look a little ugly. ![]()
The other thing about the debug boxes is that the current defaults are already highlighted. For example, look at the "kissflow" boxes below:
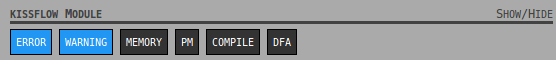
and compare it against the output from this command:
[Expert@gw-9de5b8:0]# fw ctl debug -m kissflow
Kernel debugging buffer size: 50KB
Module: kissflow
Enabled Kernel debugging options: error warning
Messaging threshold set to type=Info freq=CommonSee how the default options of "error warning" are highlighted in the "kissflow" module? This way here, users don't have to turn them on since they're on by default. Only when making changes to a module will the "-m $MODULE +/- $FLAGS" show up.
I hope this clears things up. ![]()
Sean (Gr@ve_Rose)
- Mark as New
- Bookmark
- Subscribe
- Mute
- Subscribe to RSS Feed
- Permalink
- Report Inappropriate Content
amazing job, thanks
- Mark as New
- Bookmark
- Subscribe
- Mute
- Subscribe to RSS Feed
- Permalink
- Report Inappropriate Content
Thanks Valeri Loukine! It was your suggestion to post in this thread that got this all started. Looks like I owe you an Internet beer as well. ![]()
- Mark as New
- Bookmark
- Subscribe
- Mute
- Subscribe to RSS Feed
- Permalink
- Report Inappropriate Content
No sir, beers are on me. Or Dameon Welch Abernathy, depending on who catches you first
- Mark as New
- Bookmark
- Subscribe
- Mute
- Subscribe to RSS Feed
- Permalink
- Report Inappropriate Content
Regarding Kernel Debugs for Check Point:
My suggestion is to add notification (warning) that after debugs are done, end user should use fw ctl debug 0 to reset all kernel debugs.
Kind regards,
Jozko Mrkvicka
Jozko Mrkvicka
- Mark as New
- Bookmark
- Subscribe
- Mute
- Subscribe to RSS Feed
- Permalink
- Report Inappropriate Content
Ask and ye shall receive. ![]() I've also created a subreddit (and linked to it in the page) so that other people (not CheckMates members) can participate in the discussions: https://www.reddit.com/r/tcpdump101/ Of course, I'll still be here doing my best to help out whenever I can, trying to score free beers from random Internet friends.
I've also created a subreddit (and linked to it in the page) so that other people (not CheckMates members) can participate in the discussions: https://www.reddit.com/r/tcpdump101/ Of course, I'll still be here doing my best to help out whenever I can, trying to score free beers from random Internet friends.
- Mark as New
- Bookmark
- Subscribe
- Mute
- Subscribe to RSS Feed
- Permalink
- Report Inappropriate Content
Great work Sean
- Mark as New
- Bookmark
- Subscribe
- Mute
- Subscribe to RSS Feed
- Permalink
- Report Inappropriate Content
Thanks for the kind words, Gaurav Pandya. I hope you find it helpful. ![]()
- Mark as New
- Bookmark
- Subscribe
- Mute
- Subscribe to RSS Feed
- Permalink
- Report Inappropriate Content
great stuff Sean! very very useful kit ![]()
well done YOU!
Jerry
- Mark as New
- Bookmark
- Subscribe
- Mute
- Subscribe to RSS Feed
- Permalink
- Report Inappropriate Content
Thanks Jerry Szpinak! I'm glad you think it's useful and hopefully it helps you (and others). ![]()
- Mark as New
- Bookmark
- Subscribe
- Mute
- Subscribe to RSS Feed
- Permalink
- Report Inappropriate Content
This is wonderful Sean Murray-Ford! I really like it and possibility to download and use offline is super!
- Mark as New
- Bookmark
- Subscribe
- Mute
- Subscribe to RSS Feed
- Permalink
- Report Inappropriate Content
You're wonderful, Petr Hantak! I wanted to make sure that it was written in "flat" languages so I used HTML, JavaScript and CSS so that people could use it offline without the need to have a server or even Internet connectivity. It's why I stayed away from jQuery since, usually, it's an external include to the library. I hope you find it useful. ![]()
- Mark as New
- Bookmark
- Subscribe
- Mute
- Subscribe to RSS Feed
- Permalink
- Report Inappropriate Content
You choose very good solution combination. HTML, JavaScript and CSS works almost everywhere and almost all mobile devices hasn't got problem with it as well. ![]()
- Mark as New
- Bookmark
- Subscribe
- Mute
- Subscribe to RSS Feed
- Permalink
- Report Inappropriate Content
This is a great tool! I've been playing around with it for a bit and a couple thoughts:
- I couldn't find a good way to add a new filter option into the middle of the overall filter. When I clicked 'Add New Filter Option', it added the new option to the bottom of the filter. This was troublesome when I missed a parenthesis and had to re-enter everything from the missed parenthesis to the bottom. I couldn't figure out if there was a way to move filter options up and down in the overall filter
- It would be cool to be able to quickly move filters from one tool to another (where possible). For example, being able to quickly take the filter created for tcpdump and apply it directly to fw monitor to get that syntax. I know the 'special' syntax things for each tool wouldn't port over, but the basic src/dst IP, and port info should.
- Currently, if you add a filter option (eg. source IP address = 1.1.1.1), and then change the drop-down box to any other type of option (eg. source or destination IP address), it wipes out the field completely. It would be useful if the data typed into the field carried over so it didn't have to be re-typed each time. If the field type changes (eg. IP address to Network address), maybe highlight the field red or call out an error that the formatting must change (in this case to add the CIDR notation for the network.)
Thanks for your work on this. It is an awesome tool! I'll be recommending it to my peers!
- Mark as New
- Bookmark
- Subscribe
- Mute
- Subscribe to RSS Feed
- Permalink
- Report Inappropriate Content
Thanks Phillip Runner for the great reply and suggestions!
- Adding a new filter to the middle of an already existing syntax string. I really like that idea! It's going to be a bit of time before I'll be able to port that in since it will require modifying both the existing syntax options as well as the top-most command spans, but it's definitely do-able. This will probably be a major release update to put these in (a.k.a. a total front-end redesign) but I look forward to the challenge and the feature you've suggested.

- Moving filters from one tool to another. I had thought about this but then talked myself out of it since I figured people would rarely be on multiple vendors at the same time (even though I usually am) and may not have use for it. The other item I wanted to add in which may satisfy your suggestion, was a PCap wizard. You would put in what you want in a "next-next-finish" fashion and then output your command based on the type you selected. If I make the selection type at the end (or even have a "show all" option), would that be useful?
- Have values stay when an option is changed and present a warning/error. This is probably the most difficult one to do for a few reasons:
- Each drop-down option changes the filter input type with Javascript by removing the existing HTML and putting new HTML in it's place. When this happens, the existing information is gone into the void. It could be possible to grab a hold of "this.value" before the change and populate the new "this.value" with the previous contents but I don't want to confuse people if values are pre-populated; Especially if the values are incorrect (if you go from source IP to ethernet address as an example). This leads to your second suggestion on the same subject...
- Present a warning if values appear to be incorrect. I've struggled with this ever since day one.
 The issue is that I don't know what people are using for filters. Let's stick with the "host" filter to keep things simple. With that option, we could have one of three possible valid values: IPv4 address, IPv6 address and hostname. I don't know what people will be putting in so "1.2.3.4", "2001:bad:c0de::1" and "1.2.3.4.com" are all good entries but how do I determine (through RegEx) which one the user actually is putting in? I could put another option for users to select "I am putting in an IPv6 address" or whatever but I don't want to overload the user with too many options to have to select just to build their command. It's also entirely possible that the RegEx is floating around on StackOverflow somewhere and I just haven't seen it. I'll keep looking into this (since I really want to have this feature) and if I find a viable solution, I'll code it in.
Thanks again for the great suggestions and I'm glad you find it helpful.
- Mark as New
- Bookmark
- Subscribe
- Mute
- Subscribe to RSS Feed
- Permalink
- Report Inappropriate Content
Great work! Congrats!
- Mark as New
- Bookmark
- Subscribe
- Mute
- Subscribe to RSS Feed
- Permalink
- Report Inappropriate Content
Thanks for the kind words, Danilo Lara! I hope you (and others) find it helpful. ![]()
- Mark as New
- Bookmark
- Subscribe
- Mute
- Subscribe to RSS Feed
- Permalink
- Report Inappropriate Content
Thank you for sharing.. I will certainly check it out and provide feedback after some use.
Stay well.
-DL
- Mark as New
- Bookmark
- Subscribe
- Mute
- Subscribe to RSS Feed
- Permalink
- Report Inappropriate Content
And thanks to you, Diego Lopez, for the reply. I look forward to your feedback and hope you find it useful. ![]()
- Mark as New
- Bookmark
- Subscribe
- Mute
- Subscribe to RSS Feed
- Permalink
- Report Inappropriate Content
Great tool
It's the simple way to freeze the brain 😛 ... stop with keeping the command line in the own mind
LOL
- Mark as New
- Bookmark
- Subscribe
- Mute
- Subscribe to RSS Feed
- Permalink
- Report Inappropriate Content
Thanks for the kind words, Gianluca Giordano! I hope you find it useful. ![]()
- Mark as New
- Bookmark
- Subscribe
- Mute
- Subscribe to RSS Feed
- Permalink
- Report Inappropriate Content
Hey everyone. I've made some small changes, most of which stem from great suggestions coming from this thread! ![]()
- Whenever you add something, change something or type something, the top bar will flash for a brief moment of what was changed. Hopefully this will draw the eye up to where the command is being built. (Suggestion by Vladimir Yakovlev)
- There's a bit more space between the top bar and the horizontal line separator and the initial "Not" is highlighted in red in the filters area. (Suggestion by Vladimir Yakovlev)
- The syntax options are now in a "regular" font instead of the "small-caps" variant making it easier to know if you should use "-i" or "-I" on fields. (Suggestion by Hacker News thread)
- There is no more strict checking on interface names for tcpdump and other vendors. Instead, a warning appears below but the command syntax still updates. (Suggestion by Twitter user @gbraad)
I'm going to start working on the next UI iteration which will look more streamlined and allow me to add in more features which have been suggested here and other places. You'll be able to follow along at http://dev.tcpdump101.com once I get a baseline created and hosted.
I'm always open to suggestions and will continue to maintain the existing version so if you have more you'd like to see or want to provide any feedback, please let me know either here, through Twitter @Grave_Rose or on the /r/tcpdump101 subReddit.
Again, thanks to everyone for the suggestions and, in all honesty, the great reception - It means a lot to me to know that something I've created is helping people learn.
Sean (Gr@ve_Rose)
- Mark as New
- Bookmark
- Subscribe
- Mute
- Subscribe to RSS Feed
- Permalink
- Report Inappropriate Content
Keep up the good job, Sean Murray-Ford, we appreciate your efforts deeply.
- Mark as New
- Bookmark
- Subscribe
- Mute
- Subscribe to RSS Feed
- Permalink
- Report Inappropriate Content
Hi Sean Murray-Ford,
Great work on the latest update !
My next suggestions and remarks:
1. Freeze output lines to be on the top of the screen. It is really hard to show all options available and see what you have already setup. You need to scroll to the beginning of the page to see result.
2. Why there is horizontal scroll bar ? Only Cisco ASA doesnt have horizontal scroll bar. Scroll bar is also in the Menu.
3. Statement: "Copy not supported on this module. Press Ctrl+C to copy." in kernal debugs for Check Point should be on the same place as is in packet captures page - right after the Highlight command. Add few more empty lines would be also great, to have it even more visible that copy in these 2 cases in not possible (need to press ctrl + c anyway).
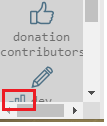
4. Hidden option ?  This picture (partially visible) of "signal strength" is static and is seen on the bottom of the page during scrolling in the Menu.

Kind regards,
Jozko Mrkvicka
Jozko Mrkvicka
- Mark as New
- Bookmark
- Subscribe
- Mute
- Subscribe to RSS Feed
- Permalink
- Report Inappropriate Content
Jozko Mrkvicka - Are you a magician because you're reading my mind. ![]()
- I did this in the older version and wanted to do it for this one but my CSS skills weren't as good as they needed to be at the time. When I moved the menu to the left, I didn't code the <div> properly so I couldn't freeze the commands but it is something I'm working on for the next design.
- The horizontal scrollbar usually only shows up with a smaller resolution on the users web browser. Just as an FYI, the left menu bar is hardcoded at 100px. Are you using this on mobile or desktop? I haven't designed for mobile since I doubted that people would use this on a mobile device - Usually people will be on a computer when running packet captures. I may try and do some mobile design for the next version but it's not at the top of my list.
- I like the idea and this actually ties into a suggestion by Vladimir Yakovlev about moving the button to the right side instead of below. I think I'll give this more serious consideration now that it's been brought up again.
- That just brings up a small status bar at the bottom when hovered over showing the different statuses for the modules. I've coded it as "display: fixed;" so it will always be at the bottom but maybe I'll just make another icon for it or possibly remove it since the splash page shows the same information.
Thanks again for the great suggestions!
- Mark as New
- Bookmark
- Subscribe
- Mute
- Subscribe to RSS Feed
- Permalink
- Report Inappropriate Content

Thank you for your comments, really appreciate ![]()
Regarding to the point n. 2:
I was checking it on the desktop. Using Chrome and resolution 1440 x 900. Forget to do mobile version - wasting of your time here. All users will visit site on the desktop anyway.
Kind regards,
Jozko Mrkvicka
Jozko Mrkvicka
- Mark as New
- Bookmark
- Subscribe
- Mute
- Subscribe to RSS Feed
- Permalink
- Report Inappropriate Content
This is really grate tool and this was really helpful to me. thanks for your effort and time.
- Mark as New
- Bookmark
- Subscribe
- Mute
- Subscribe to RSS Feed
- Permalink
- Report Inappropriate Content
Thanks for the kind words, Dhananja Kariyawasam! I'm glad you find it useful. With positive encouragement from the Network/NetSec communities as well as good feedback on how to make it better, I'm hoping to add more features and make it more functional for everyone to learn packet captures! ![]()
Leaderboard
Epsum factorial non deposit quid pro quo hic escorol.
| User | Count |
|---|---|
| 16 | |
| 6 | |
| 5 | |
| 3 | |
| 2 | |
| 2 | |
| 1 | |
| 1 | |
| 1 | |
| 1 |
Trending Discussions
Upcoming Events
Tue 28 Jul 2026 @ 11:00 AM (EDT)
Under the Hood - Check Point and Illumio – Modern Network Defense Against AI-Based ThreatsWed 29 Jul 2026 @ 12:00 PM (SGT)
The AI Security Report 2026: A Turning Point for Enterprise Defense - SGTWed 29 Jul 2026 @ 02:00 PM (IDT)
The AI Security Report 2026: A Turning Point for Enterprise Defense - AMERWed 29 Jul 2026 @ 03:00 PM (CEST)
The AI Security Report 2026: A Turning Point for Enterprise Defense EMEATue 28 Jul 2026 @ 11:00 AM (EDT)
Under the Hood - Check Point and Illumio – Modern Network Defense Against AI-Based ThreatsWed 29 Jul 2026 @ 12:00 PM (SGT)
The AI Security Report 2026: A Turning Point for Enterprise Defense - SGTWed 29 Jul 2026 @ 02:00 PM (IDT)
The AI Security Report 2026: A Turning Point for Enterprise Defense - AMERWed 29 Jul 2026 @ 03:00 PM (CEST)
The AI Security Report 2026: A Turning Point for Enterprise Defense EMEAThu 30 Jul 2026 @ 10:00 AM (PDT)
AI Security Masters E12: READY OR NOT: Securing the AI Enterprise 4/5 - AI GatewayThu 20 Aug 2026 @ 08:30 AM (COT)
Medellin: Workspace Evolution: Hybrid Mesh Management - Visibilidad, Automatización e IAThu 20 Aug 2026 @ 06:00 PM (COT)
Medellin: Workspace Intelligence: IA Generativa en Acción para Equipos de SeguridadAbout CheckMates
Learn Check Point
Advanced Learning
YOU DESERVE THE BEST SECURITY

©1994-2026 Check Point Software Technologies Ltd. All rights reserved.
Copyright
Privacy Policy
About Us
UserCenter