- Products
- Learn
- Local User Groups
- Partners
- More
This website uses Cookies. Click Accept to agree to our website's cookie use as described in our Privacy Policy. Click Preferences to customize your cookie settings.
- Products
- Learn
- Local User Groups
- Upcoming Events
- Americas
- EMEA
- Czech Republic and Slovakia
- Denmark
- Netherlands
- Germany
- Sweden
- United Kingdom and Ireland
- France
- Spain
- Norway
- Ukraine
- Baltics and Finland
- Greece
- Portugal
- Austria
- Kazakhstan and CIS
- Switzerland
- Romania
- Turkey
- Belarus
- Belgium & Luxembourg
- Russia
- Poland
- Georgia
- DACH - Germany, Austria and Switzerland
- Iberia
- Africa
- Adriatics Region
- Eastern Africa
- Israel
- Nordics
- Middle East and Africa
- Balkans
- Italy
- Bulgaria
- Cyprus
- APAC
- Partners
- More
- ABOUT CHECKMATES & FAQ
- Sign In
- Leaderboard
- Events
Step Into the Future of
AI-Powered Cyber Security
The State of Ransomware Q1 2026
Key Trends and Their Impact
AI Security Masters E8:
Claude Mythos: New Era in Cyber Security
Blueprint Architecture for Securing
The AI Factory & AI Data Center
Call For Papers
Your Expertise. Our Stage
CheckMates Go:
CheckMates Fest
Turn on suggestions
Auto-suggest helps you quickly narrow down your search results by suggesting possible matches as you type.
Showing results for
- CheckMates
- :
- Products
- :
- General Topics
- :
- Re: Viewing concurrent tunnels information
Options
- Subscribe to RSS Feed
- Mark Topic as New
- Mark Topic as Read
- Float this Topic for Current User
- Bookmark
- Subscribe
- Mute
- Printer Friendly Page
Turn on suggestions
Auto-suggest helps you quickly narrow down your search results by suggesting possible matches as you type.
Showing results for
Are you a member of CheckMates?
×
Sign in with your Check Point UserCenter/PartnerMap account to access more great content and get a chance to win some Apple AirPods! If you don't have an account, create one now for free!
- Mark as New
- Bookmark
- Subscribe
- Mute
- Subscribe to RSS Feed
- Permalink
- Report Inappropriate Content
Jump to solution
Viewing concurrent tunnels information
Hello all,
I'm hoping someone can provide me with some information on how I can obtain a specific statistic. I'm looking to understand the level at which the 'concurrent tunnels' is running at so that I can compare this to the limit that is in place.
I've been able to view the number of concurrent 'connections' but I need to run the equivalent for concurrent tunnels. If someone could advise on any commands that I could run, or whether this information is accessible elsewhere, that would be great.
Thanks in advance.
1 Solution
Accepted Solutions
- Mark as New
- Bookmark
- Subscribe
- Mute
- Subscribe to RSS Feed
- Permalink
- Report Inappropriate Content
The reason why the tunnel was shown as "Down" is because it is configured as a "Permanent" tunnel when it should not have been configured as such.
Permanent tunnels are for Check Point to Check Point VPN tunnels. In this case, there is something else than a Check Point firewall at the other end.
From the documentation:
" A VPN tunnel is monitored by periodically sending "tunnel test" packets. As long as responses to the packets are received the VPN tunnel is considered "up." If no response is received within a given time period, the VPN tunnel is considered "down." Permanent Tunnels can only be established between Check Point Security Gateways."
15 Replies
- Mark as New
- Bookmark
- Subscribe
- Mute
- Subscribe to RSS Feed
- Permalink
- Report Inappropriate Content
Keep in mind that there are IKE/P1 and IPSEC/P2 tunnels for each connection to a VPN peer, along with inbound and outbound tunnels/SAs for each. Every individual tunnel/SA is represented by a SPI.
If you are using R80.10 on your firewall, this is pretty easy though: vpn tu mstats, and use command vpn tu tlist for more specific information about a tunnel.
For R77.30 and earlier you could use:
fw tab -s -t inbound_SPI
fw tab -s -t outbound_SPI
Also give this a try:
fw tab -u -t peers_count
Check out this rather lengthy but invaluable SK for more information: sk104760: ATRG: VPN Core
--
Second Edition of my "Max Power" Firewall Book
Now Available at http://www.maxpowerfirewalls.com
New Book: "Max Power 2026" Coming Soon
Check Point Firewall Performance Optimization
Check Point Firewall Performance Optimization
- Mark as New
- Bookmark
- Subscribe
- Mute
- Subscribe to RSS Feed
- Permalink
- Report Inappropriate Content
Good place to start will be by using:
cpstat -f all vpn
from Clish.
For tunnel manipulation, you can use the:
vpn tu
from Expert mode.
And if you are working with remote access vpns specifically, use:
pep show user all
from Expert mode
Cheers,
Vladimir
- Mark as New
- Bookmark
- Subscribe
- Mute
- Subscribe to RSS Feed
- Permalink
- Report Inappropriate Content
There's also SmartView Monitor.
In R80+:
- Open SmartConsole > Logs & Monitor.
- Open the catalog (new tab).
- Click Tunnel & User Monitoring.
See also: Logging and Monitoring R80.10 (Part of Check Point Infinity)
- Mark as New
- Bookmark
- Subscribe
- Mute
- Subscribe to RSS Feed
- Permalink
- Report Inappropriate Content
Hello Dameon,
I'm trying to follow your advice, but I run into particular behavior.
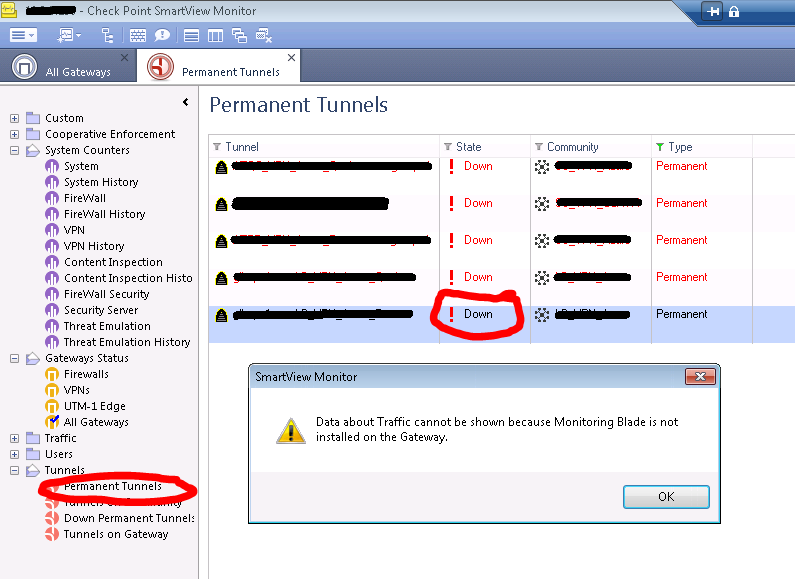
In SmartView Monitor R80.10 using VSX gateways, when I go to Tunnels -> Permanent Tunnels for example, I can see a list of my VPN tunnels, but it says their state is all "Down", when in fact they are all up and running.
Furthermore, if I want to see the "Top IP", I get the error message shown in this print screen:

Any ideas? Thanks in advance!
- Mark as New
- Bookmark
- Subscribe
- Mute
- Subscribe to RSS Feed
- Permalink
- Report Inappropriate Content
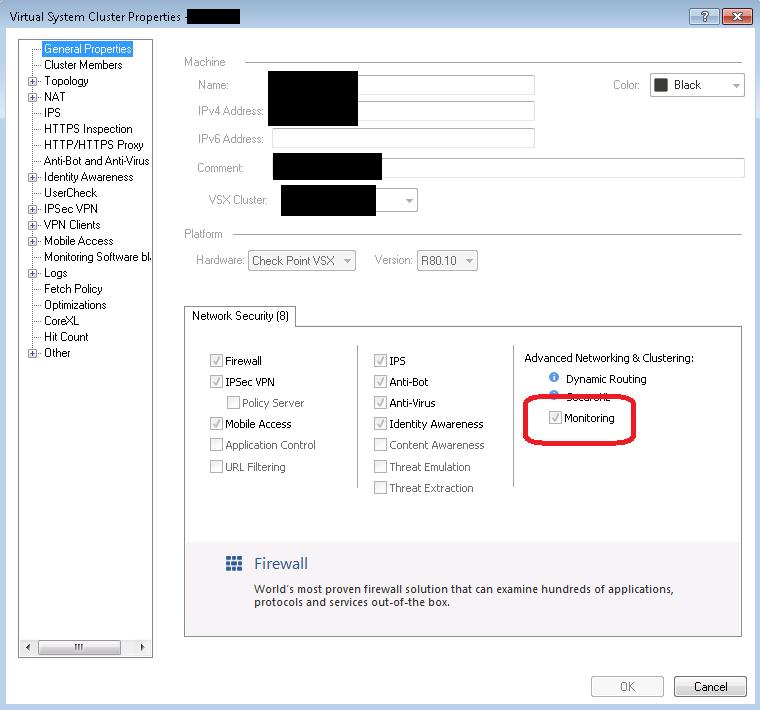
Is Monitoring enabled on the gateway, as noted in the error message?
- Mark as New
- Bookmark
- Subscribe
- Mute
- Subscribe to RSS Feed
- Permalink
- Report Inappropriate Content
Yes, it is enabled, sorry I forgot to mention it.
We are talking about this, right?

- Mark as New
- Bookmark
- Subscribe
- Mute
- Subscribe to RSS Feed
- Permalink
- Report Inappropriate Content
That's what I was talking about.
Maybe worth a TAC case.
- Mark as New
- Bookmark
- Subscribe
- Mute
- Subscribe to RSS Feed
- Permalink
- Report Inappropriate Content
Have a look at this for the tunnels showing down:
Permanent tunnels shows "down" in SmartView Monitor, even though the VPN tunnel is up
- Mark as New
- Bookmark
- Subscribe
- Mute
- Subscribe to RSS Feed
- Permalink
- Report Inappropriate Content
- Mark as New
- Bookmark
- Subscribe
- Mute
- Subscribe to RSS Feed
- Permalink
- Report Inappropriate Content
The reason why the tunnel was shown as "Down" is because it is configured as a "Permanent" tunnel when it should not have been configured as such.
Permanent tunnels are for Check Point to Check Point VPN tunnels. In this case, there is something else than a Check Point firewall at the other end.
From the documentation:
" A VPN tunnel is monitored by periodically sending "tunnel test" packets. As long as responses to the packets are received the VPN tunnel is considered "up." If no response is received within a given time period, the VPN tunnel is considered "down." Permanent Tunnels can only be established between Check Point Security Gateways."
- Mark as New
- Bookmark
- Subscribe
- Mute
- Subscribe to RSS Feed
- Permalink
- Report Inappropriate Content
Is there a command I can run on my 80.30 gateway to see encrypt / decrypt traffic or tx and rx for a specific IPSsec VPN peer?
It seems cpstat -f all vpn shows me the info for all, I want to just look at one peer gateway / vpn at a time to see how much traffic is traversing inbound and out at any given time.
- Mark as New
- Bookmark
- Subscribe
- Mute
- Subscribe to RSS Feed
- Permalink
- Report Inappropriate Content
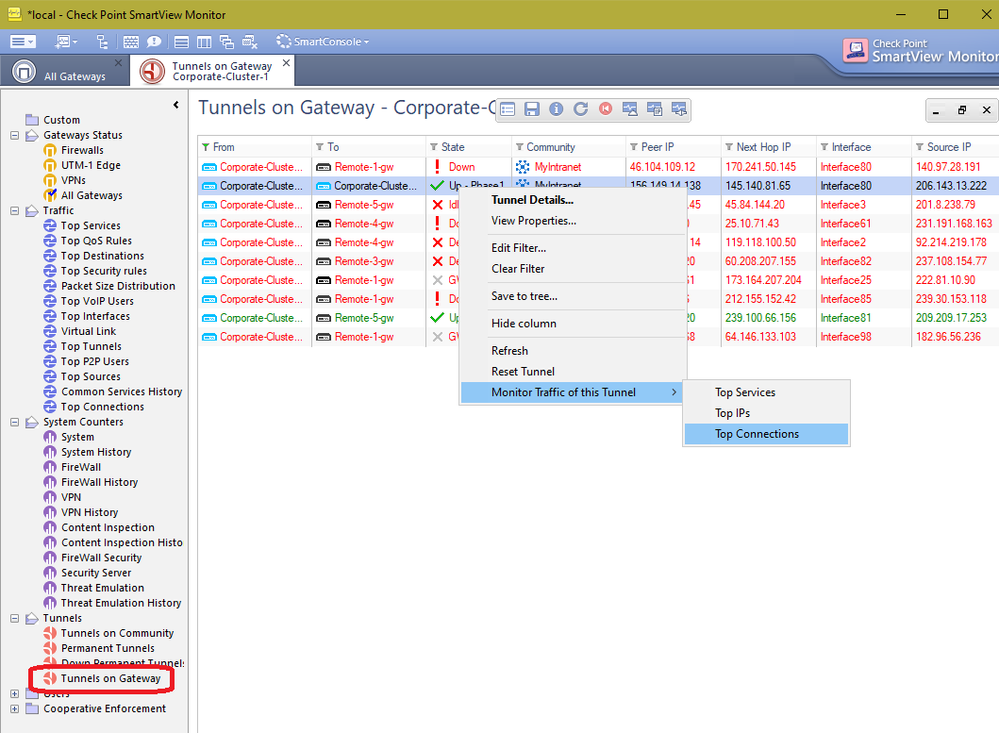
Not sure if it still works, but try this from the SmartView Monitor. The monitoring blade will most definitely need to be enabled on the relevant gateway; this view will show top connections and a summary of all bandwidth usage by the VPN tunnel in the upper-right corner of the report.
New Book: "Max Power 2026" Coming Soon
Check Point Firewall Performance Optimization
Check Point Firewall Performance Optimization
- Mark as New
- Bookmark
- Subscribe
- Mute
- Subscribe to RSS Feed
- Permalink
- Report Inappropriate Content
I am assuming I will need a monitoring blade license?
- Mark as New
- Bookmark
- Subscribe
- Mute
- Subscribe to RSS Feed
- Permalink
- Report Inappropriate Content
Yes and monitoring enabled on the gateway/cluster object.
New Book: "Max Power 2026" Coming Soon
Check Point Firewall Performance Optimization
Check Point Firewall Performance Optimization
- Mark as New
- Bookmark
- Subscribe
- Mute
- Subscribe to RSS Feed
- Permalink
- Report Inappropriate Content
Thanks a lot for this useful information. I was actually experiencing the same scenario and disabling the Permanent Tunnels has worked for my case.
Leaderboard
Epsum factorial non deposit quid pro quo hic escorol.
| User | Count |
|---|---|
| 5 | |
| 4 | |
| 4 | |
| 3 | |
| 3 | |
| 3 | |
| 3 | |
| 3 | |
| 2 | |
| 2 |
Upcoming Events
Tue 12 May 2026 @ 10:00 AM (CEST)
The Cloud Architects Series: Check Point Cloud Firewall delivered as a serviceWed 13 May 2026 @ 11:00 AM (EDT)
TechTalk: The State of Ransomware Q1 2026: Key Trends and Their ImpactThu 14 May 2026 @ 07:00 PM (EEST)
Under the Hood: Presentando Check Point Cloud Firewall como ServicioTue 12 May 2026 @ 10:00 AM (CEST)
The Cloud Architects Series: Check Point Cloud Firewall delivered as a serviceAbout CheckMates
Learn Check Point
Advanced Learning
YOU DESERVE THE BEST SECURITY
©1994-2026 Check Point Software Technologies Ltd. All rights reserved.
Copyright
Privacy Policy
About Us
UserCenter


