- Products
- Learn
- Local User Groups
- Partners
- More

This website uses Cookies. Click Accept to agree to our website's cookie use as described in our Privacy Policy. Click Preferences to customize your cookie settings.
- Products
- Learn
- Local User Groups
- Upcoming Events
- Americas
- EMEA
- Czech Republic and Slovakia
- Denmark
- Netherlands
- Germany
- Sweden
- United Kingdom and Ireland
- France
- Spain
- Norway
- Ukraine
- Baltics and Finland
- Greece
- Portugal
- Austria
- Kazakhstan and CIS
- Switzerland
- Romania
- Turkey
- Belarus
- Belgium & Luxembourg
- Russia
- Poland
- Georgia
- DACH - Germany, Austria and Switzerland
- Iberia
- Africa
- Adriatics Region
- Eastern Africa
- Israel
- Nordics
- Middle East and Africa
- Balkans
- Italy
- Bulgaria
- Cyprus
- APAC
- Partners
- More
- ABOUT CHECKMATES & FAQ
- Sign In
- Leaderboard
- Events
On-Premise SD-WAN Management
Register HereWhat's New in R82.10?
Watch Here AI Security Masters E8:
Claude Mythos: New Era in Cyber Security
CheckMates Go:
The Moment Before
Turn on suggestions
Auto-suggest helps you quickly narrow down your search results by suggesting possible matches as you type.
Showing results for
- CheckMates
- :
- Products
- :
- General Topics
- :
- My Top 3 Check Point CLI commands
Options
- Subscribe to RSS Feed
- Mark Topic as New
- Mark Topic as Read
- Float this Topic for Current User
- Bookmark
- Subscribe
- Mute
- Printer Friendly Page
Turn on suggestions
Auto-suggest helps you quickly narrow down your search results by suggesting possible matches as you type.
Showing results for
Are you a member of CheckMates?
×
Sign in with your Check Point UserCenter/PartnerMap account to access more great content and get a chance to win some Apple AirPods! If you don't have an account, create one now for free!
- Mark as New
- Bookmark
- Subscribe
- Mute
- Subscribe to RSS Feed
- Permalink
- Report Inappropriate Content
My Top 3 Check Point CLI commands
Just had a fun geeky conversation with Dameon Welch Abernathy (AKA Phoneboy) Jony Fischbein , Jeff Schwartz and Michael Poublon (over 100 accumulated years of experience in Check Point products) , on what are our favorite & most useful commands in a Check Point environment.
Below are my 3 , plz add yours in the comments (we will do a poll for the top 5 after getting your feedback ... ).
1) fw ctl zdebug drop
used to quickly see all dropped connections and more importantly the reason (e.g. anti-spoofing, IPS , FW rule , ....)
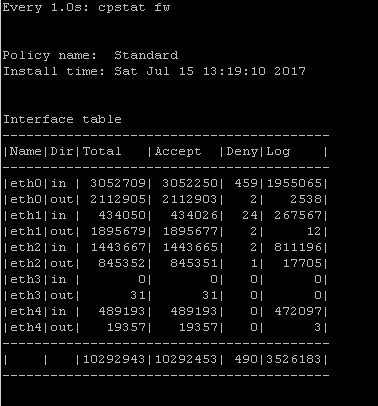
2) cpstat fw
quickly see stats of number of connections (accepted,denied,logged) with a breakdown
if the FW was under a high load i would usually run " watch --interval=1 'cpstat fw' " (would see a real-time to see the interface that is causing this)
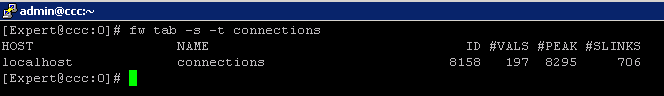
3) fw tab -s -t connections
allowed me to quickly see how much load is (and was i.e "peak" ) on the FW
that's it (i have more , but i want to hear yours ...)
plz add yours in the comments (we will do a poll for the top 5 after getting your feedback ... )
195 Replies
- Mark as New
- Bookmark
- Subscribe
- Mute
- Subscribe to RSS Feed
- Permalink
- Report Inappropriate Content
Well looks like this has turned into the most epic Checkmates thread ever and my last 3 commands were well-received, so here are some more that have not been mentioned yet. The focus for these is recovering from mistakes that normally would require a firewall outage:
1) Disable anti-spoofing on the fly from the gateway. Should you make a mistake in the anti-spoofing config the results can be dire: lots of traffic suddenly being dropped by the gateway. Once the specific interface with the problem has been identified, best practice dictates setting the antispoofing setting for that interface to "Detect" and reinstalling policy. On R80+ Management, quickly reverting the gateway to a known-good policy via the "Installation History" screen is a good choice as well. At that point you can figure out what went wrong at your leisure.
But what if antispoofing is now dropping all management traffic to/from the SMS itself? A corrected policy can't be pushed, and new logs can no longer be received from the firewall either to figure out what is going on. The usual way of breaking this catch-22 that involves taking a full outage on the firewall is:
1) Log into firewall (probably on console)
2) Unplug/disable externally-facing interface to protect firewall
3) Run fw unloadlocal (full outage begins)
4) Race back to SmartConsole and push policy with corrected antispoofing
5) Restore external-facing interface (full outage ends)
But there is a better way that does not involve taking a full outage, and these expert mode gateway commands can also be used as a bit of a "panic button" in regards to an antispoofing problem:
fw ctl set int fw_antispoofing_enabled 0
sim feature anti_spoofing off ; fwaccel off ; fwaccel on
All antispoofing enforcement on the gateway is immediately disabled. While these settings will not survive a gateway reboot, they will survive a policy re-installation and cprestart, so once the issue is corrected make sure to turn anti-spoofing back on like this:
fw ctl set int fw_antispoofing_enabled 1
sim feature anti_spoofing on ; fwaccel off ; fwaccel on
Edit: The above commands work for R80.10 and earlier, for R80.20+ use these commands instead:
fw ctl set int fw_antispoofing_enabled 0
fw ctl set int sim_anti_spoofing_enabled 0 -a
2) Recover from SIC issues between SMS and gateway without an outage. If SIC somehow gets broken between a single gateway and the SMS and must be reset, the traditional way of dealing with it is to run "cpconfig" on the gateway, reset SIC and enter a new activation key. Unfortunately doing it this way causes the gateway to not only discard its current SIC certificate, but also discard its current installed security policy and load up the default "InitialPolicy", which blocks almost all traffic and causes a full outage until policy is reinstalled/fetched from the SMS.
A far more problematic situation though is when the certificate of the SMS itself gets corrupted/changed (or the ICA somehow gets reset brutally) and SIC trust gets instantly broken between all managed gateways and the SMS. Now you're staring down the barrel of outages on all non-clustered gateways to recover control. But there is a way to have the gateway discard its SIC certificate and set a new activation key, but without discarding its installed security policy taken from sk86521: Reset SIC without restarting the firewall process:
On the gateway run:
cp_conf sic init ACTIVATIONKEY norestart
cpwd_admin stop -name CPD -path "$CPDIR/bin/cpd_admin" -command "cpd_admin stop"
cpwd_admin start -name CPD -path "$CPDIR/bin/cpd" -command "cpd"
Trust can now be reestablished to to the gateway and policy reinstalled, all without an outage!
3) Regain gateway CLI access via SIC if admin and/or expert passwords are unknown/corrupt. The typical outage-inducing way to recover from this situation: Factory reset a gateway appliance (and pray you have a good backup to restore containing passwords that you know) or on open hardware boot from a live Linux distribution DVD/USB media like Knoppix and try to hack the password that way.
The cprid_util command has been mentioned a few times in this thread, but bears repeating for this situation. If for some reason you cannot log into the gateway CLI, assuming SIC is still established between the gateway and the SMS (and SIC traffic is not being impeded by firewall policy), you can execute commands on the gateway from the SMS via the SIC trust without a password.
Here is a sample command to reset the gateway's admin password, taken from sk106490: How to remotely reset Admin / Expert password on a Security Gateway from a Security Manage...:
$CPDIR/bin/cprid_util -server <IP_address_of_Security_Gateway> -verbose rexec -rcmd /bin/clish -s -c 'set user admin password-hash <password hash generated by grub-md5-crypt command>'
--
My book "Max Power: Check Point Firewall Performance Optimization"
now available via http://maxpowerfirewalls.com.
New Book: "Max Power 2026" Coming Soon
Check Point Firewall Performance Optimization
Check Point Firewall Performance Optimization
- Mark as New
- Bookmark
- Subscribe
- Mute
- Subscribe to RSS Feed
- Permalink
- Report Inappropriate Content
Awesome !! I was not aware of the anti-spoofing trick , could have saved me a lot of time during sleepless nights 😉
- Mark as New
- Bookmark
- Subscribe
- Mute
- Subscribe to RSS Feed
- Permalink
- Report Inappropriate Content
I am usually onsite with our customers and showing them how to use our products or troubleshooting issues on their network. For these scenarios (in addition to most of the other CLI commands already mentioned) I like:
fw monitor
show commands feature <feature> - This let's the customer see all the commands of that particular feature he/she can use.
For example all the Gaia commands for OSPF:
mgmt-server> show commands feature ospf
set ospf area VALUE nssa default-cost VALUE
set ospf area VALUE nssa default-metric-type VALUE
set ospf area VALUE nssa import-summary-routes off
set ospf area VALUE nssa import-summary-routes on
set ospf area VALUE nssa off
set ospf area VALUE nssa on
set ospf area VALUE nssa range VALUE off
set ospf area VALUE nssa range VALUE on
set ospf area VALUE nssa range VALUE restrict VALUE off
set ospf area VALUE nssa range VALUE restrict VALUE on
set ospf area VALUE nssa redistribution off
set ospf area VALUE nssa redistribution on
set ospf area VALUE nssa translator-role VALUE
set ospf area VALUE nssa translator-stability-interval VALUE
set ospf area VALUE off
set ospf area VALUE on
set ospf area VALUE range VALUE off
set ospf area VALUE range VALUE on
set ospf area VALUE range VALUE restrict VALUE off
set ospf area VALUE range VALUE restrict VALUE on
set ospf area VALUE stub default-cost VALUE
set ospf area VALUE stub off
set ospf area VALUE stub on
set ospf area VALUE stub summary off
set ospf area VALUE stub summary on
set ospf area VALUE stub-network VALUE off
set ospf area VALUE stub-network VALUE on
set ospf area VALUE stub-network VALUE stub-network-cost VALUE
set ospf area VALUE virtual-link VALUE transit-area VALUE authtype md5 key VALUE off
set ospf area VALUE virtual-link VALUE transit-area VALUE authtype md5 key VALUE secret VALUE
set ospf area VALUE virtual-link VALUE transit-area VALUE authtype none
set ospf area VALUE virtual-link VALUE transit-area VALUE authtype simple VALUE
set ospf area VALUE virtual-link VALUE transit-area VALUE dead-interval VALUE
set ospf area VALUE virtual-link VALUE transit-area VALUE hello-interval VALUE
set ospf area VALUE virtual-link VALUE transit-area VALUE off
set ospf area VALUE virtual-link VALUE transit-area VALUE on
set ospf area VALUE virtual-link VALUE transit-area VALUE retransmit-interval VALUE
set ospf default-ase-cost VALUE
set ospf default-ase-type VALUE
set ospf export-routemap VALUE off
set ospf export-routemap VALUE preference VALUE on
set ospf graceful-restart grace-period VALUE
set ospf graceful-restart off
set ospf graceful-restart on
set ospf graceful-restart-helper VALUE off
set ospf graceful-restart-helper VALUE on
set ospf import-routemap VALUE off
set ospf import-routemap VALUE preference VALUE on
set ospf interface VALUE area VALUE off
set ospf interface VALUE area VALUE on
set ospf interface VALUE authtype md5 key VALUE off
set ospf interface VALUE authtype md5 key VALUE secret VALUE
set ospf interface VALUE authtype none
set ospf interface VALUE authtype simple VALUE
set ospf interface VALUE cost VALUE
set ospf interface VALUE dead-interval VALUE
set ospf interface VALUE hello-interval VALUE
set ospf interface VALUE passive VALUE off
set ospf interface VALUE passive VALUE on
set ospf interface VALUE priority VALUE
set ospf interface VALUE retransmit-interval VALUE
set ospf interface VALUE subtract-authlen VALUE
set ospf interface VALUE virtual-address VALUE off
set ospf interface VALUE virtual-address VALUE on
set ospf rfc1583-compatibility VALUE off
set ospf rfc1583-compatibility VALUE on
set ospf spf-delay VALUE
set ospf spf-holdtime VALUE
show ospf
show ospf border-routers
show ospf database [ detailed ]
show ospf database area VALUE [ detailed ]
show ospf database areas [ detailed ]
show ospf database asbr-summary-lsa [ detailed ]
show ospf database checksum
show ospf database database-summary
show ospf database external-lsa [ detailed ]
show ospf database network-lsa [ detailed ]
show ospf database nssa-external-lsa [ detailed ]
show ospf database opaque-lsa [ detailed ]
show ospf database router-lsa [ detailed ]
show ospf database summary-lsa [ detailed ]
show ospf database type VALUE [ detailed ]
show ospf errors
show ospf errors dd
show ospf errors hello
show ospf errors ip
show ospf errors lsack
show ospf errors lsr
show ospf errors lsu
show ospf errors protocol
show ospf events
show ospf interface VALUE [ detailed ]
show ospf interface VALUE stats
show ospf interfaces [ detailed ]
show ospf interfaces stats
show ospf neighbor VALUE [ detailed ]
show ospf neighbors [ detailed ]
show ospf packets
show ospf routemap
show ospf summary
mgmt-server>
- Mark as New
- Bookmark
- Subscribe
- Mute
- Subscribe to RSS Feed
- Permalink
- Report Inappropriate Content
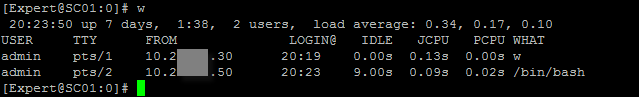
These two comes handy when you are doing an onsite engagement and you ask the customer to get out of the management because you need to start working.... The first one is actually a Linux command but still helpful.
#w or w -l
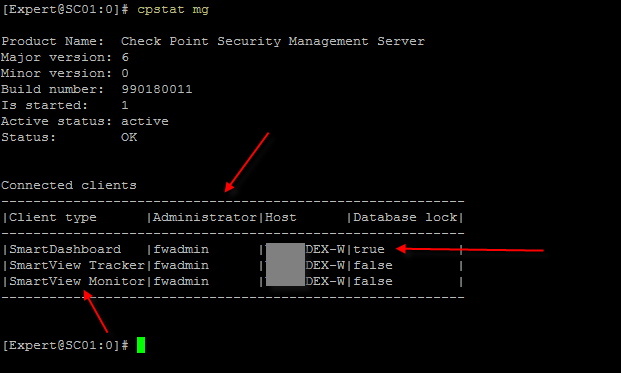
Also #cpstat mg
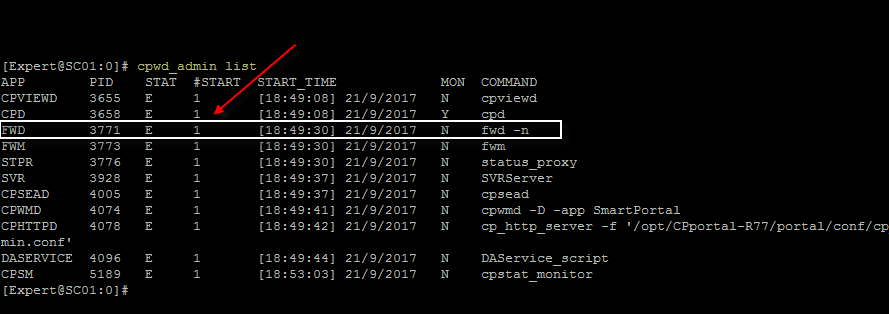
One more command that I find useful is #cpwd_admin list - this command alone can help you catch when processes are crashing and how many times they have crashed or if there is any of the processes down.
- Mark as New
- Bookmark
- Subscribe
- Mute
- Subscribe to RSS Feed
- Permalink
- Report Inappropriate Content
Hi Everyone,
I am following this discussion since the beginning and i must say that really like all the reactions so far.
A lot of useful commands and a lot of learning here!
Here is my list, maybe not my favorite commands but i didn't see them posted so far:
On the SMS
1) cpprod_util FwIsActiveManagement - To find out the current status of the active SMS (HA). 1= Active 0= Standby
On the SG
2) cp_conf sic state - shows trust state of SIC
All CP Products
3) cpstat os -f ifconfig - really nice summary of interface stats
Greetings,
Jelle
- Mark as New
- Bookmark
- Subscribe
- Mute
- Subscribe to RSS Feed
- Permalink
- Report Inappropriate Content
I left out the basic stuff and I'm listing the commands I find myself using when looking at odd issues.
clish -c "show route summary" = This gives you a quick snapshot of your routing table
cphaprob -a if = This will give you a quick peek at your Interfaces/IP Address/VMAC
fw ctl multik stat = This will tell you how hard your procs are getting hit with connections
- Mark as New
- Bookmark
- Subscribe
- Mute
- Subscribe to RSS Feed
- Permalink
- Report Inappropriate Content
Haven't tested if this one works on R80, but has been a very usefull command to restart fwd. In a cluster this will not trigger a failover:
cpwd_admin stop -name FWD -path "$FWDIR/bin/fw" -command "fw kill fwd" ; cpwd_admin start -name FWD -path "$FWDIR/bin/fw" -command "fwd"
- Mark as New
- Bookmark
- Subscribe
- Mute
- Subscribe to RSS Feed
- Permalink
- Report Inappropriate Content
An earlier post noted the command cpstat mg which reminded me of a PRE R80.x command I use to use to check if any one is logged into Dashboard :
#send_command
Enter Server name (ENTER for 'localhost'):
#send_command> connected_clients
--------------------------------------------------------------------------------------------------------------------
| # |Session Id |Client type |Administrator |Database Mode |Database Lock |Login Time |
| 1 |d42f3f50 |Command Sender |localhost |read-write |false |Mon Oct 16 08:45:09 2017|
--------------------------------------------------------------------------------------------------------------------
This is particularly useful in scenarios where I know the customer has lots of potential users logged into read only mode, usually checking logging and monitoring etc.
This always used to cause issues with automated weekly migrate exports.
At least this way each user can be politely requested to log out.
This command also provides a number of other options:
end_command> connected_clinets
Commands:
connected_clients
kill_clients [-n] <session id> .... <session id>
shared_secret <community> <external-device> <password>
gen_cert <object-name>
change_to_active
change_to_standby
manual_synchronize
manual_synchronize_me
db_change_since_last_revision
db_change_since_last_save
delete_policies
fwm_dump_log <start|stop|print>
quit
USE AT YOUR DISCRETION. There may be other ways to achieve the same functionality.
John Tammaro
CCMA
- Mark as New
- Bookmark
- Subscribe
- Mute
- Subscribe to RSS Feed
- Permalink
- Report Inappropriate Content
I'm not sure but I'd be careful not to place much confidence in fw tab -s -t connections
Especially the "peak" output.
I believe that is the peak since the firewall was first started. Not a current state.
- Mark as New
- Bookmark
- Subscribe
- Mute
- Subscribe to RSS Feed
- Permalink
- Report Inappropriate Content
Yeah i know ...
this is why I wrote "allowed me to quickly see how much load is (and was i.e "peak" ) on the FW "
usually back in the days when I was doing PS at a partner (worked at NetVision (CCMA #9 baby  ))
))
I would get called to see a FW that is "acting up" .some of the times by the time I got there it was working smooth
so this (with 'fw ctl pstat |grep "fail" ') allowed me to see if it was experiencing heavy load and then dig further .
- Mark as New
- Bookmark
- Subscribe
- Mute
- Subscribe to RSS Feed
- Permalink
- Report Inappropriate Content
Great article!
- Mark as New
- Bookmark
- Subscribe
- Mute
- Subscribe to RSS Feed
- Permalink
- Report Inappropriate Content
cpwd_admin (list) etc
cpmiquerybin or queryDB_util
cprid_util -server 1.2.3.4 rexec -rcmd /bin/bash -c "....."
xargs for everything! ![]()
- Mark as New
- Bookmark
- Subscribe
- Mute
- Subscribe to RSS Feed
- Permalink
- Report Inappropriate Content
cpmiquerybin or queryDB_util
What’s the expected output?
- Mark as New
- Bookmark
- Subscribe
- Mute
- Subscribe to RSS Feed
- Permalink
- Report Inappropriate Content
#General commands
tcpdump
cpwd_admin list
ps -aufxxx
fw tab -s -t connections
cpstat -f cpu os
cpstat -f memory os
fw ctl zdebug drop
curl_cli
arp -na
tecli
top
#CoreXL
fw ctl multik stat
fw ctl affinity -l -r -a -v
#Clustering commands - ClusterXL
cphaprob
cphaprob -a if
cphaprob list
clusterXL_admin down / up
#Better do not forget.
save config ( kkkkkkk )
- Mark as New
- Bookmark
- Subscribe
- Mute
- Subscribe to RSS Feed
- Permalink
- Report Inappropriate Content
Some useful ones
tcptraceroute -T -p 443 10.0.0.1
-T for TCP -U for UDP and -I for icmp, p for port then IP address, allows you to see if there is latency or access list / firewall blocking the traffic.
(in R80.10 onwards)
iketool -f filename (command line tool for looking at ike debugs on the gateway!)
tcpdump -nepi Sync -x port -s 0 8116 2> /dev/null | ccp_analyzer -g -c
Useful tool shows you the ccp messages in readable format from members so you can quickly understand why the cluster has issues.
- Mark as New
- Bookmark
- Subscribe
- Mute
- Subscribe to RSS Feed
- Permalink
- Report Inappropriate Content
what is this ccp_analyzer of which you speak?
- Mark as New
- Bookmark
- Subscribe
- Mute
- Subscribe to RSS Feed
- Permalink
- Report Inappropriate Content
Hi Iain,
ccp_analyzer is a tool located within the scripts directory (I forget the exact location but you can find it easily (find / -name ccp-analyzer) on a Check Point installation, it is a non documented tool as far as I am aware.
It presents you the details from the CCP packets in a human readable format. (CCP = Check Point Clustering Protocol - this document is very old yet still very relevant http://downloads.checkpoint.com/dc/download.htm?ID=10336)
You can find more information on ClusterXL here https://supportcenter.checkpoint.com/supportcenter/portal?eventSubmit_doGoviewsolutiondetails=&solutionid=sk93306.
Best Regards
Jason
- Mark as New
- Bookmark
- Subscribe
- Mute
- Subscribe to RSS Feed
- Permalink
- Report Inappropriate Content
Hi Jason,
I didn't know ccp_analyzer but I hope it doesn't work correct because I get a lot of errors and all other checks shows me, that the cluster is running fine
Check Point High Availability Protocol
Magic Number: 0x1a90
Protocol Version: Unknown(2921)
Cluster Number: 8661
HA OpCode: 11 (FWHAP_CHASSIS_STATE)
Source Interface: 2
Random ID: 25309
Source Machine ID: 1
Destination Machine ID: 65534
Policy ID: 9228
Filler: 0
Total number of cores: 6
Handling core id: 1
FWHAP_CHASSIS_STATE
Reporting Member ID: 0
Local:
Chassis State: Unknown
Standard Ports Up/Total: 0/0
Critical Ports Up/Total: 0/0
Chassis Grade: 0
Attached Blades Mask: 0
Other:
Chassis State: STANDBY
Standard Ports Up/Total: 0/0
Critical Ports Up/Total: 0/0
Chassis Grade: 0
Attached Blades Mask: 0
Active Blades: 0
In Maintenance Mode: NO
Standard Priority Port Factor: 0
High Priority Port Factor: 0
Blade Factor: 0
Failover value: 0
Are Factors Equal: NO
Sync1 link state: DOWN
Sync2 link state: DOWN
Check Point High Availability Protocol
Magic Number: 0x1a90
Protocol Version: Unknown(2921)
Cluster Number: 8661
HA OpCode: 1 (FWHA_MY_STATE)
Source Interface: 2
Random ID: 25309
Source Machine ID: 1
Destination Machine ID: 65534
Policy ID: 9228
Filler: 0
Total number of cores: 6
Handling core id: 1
FWHA_MY_STATE
Number of IDs reported: 0
Report Code: 80a, Machine information NOT present
HA mode: 2 (FWHA_BALANCE_MODE - More than one machine active)
Has Problem: YES
Chassis ID: 4
Blade State: -
Proc State: Unknown (0x402) ITERATION_FINISHED
CPU Load Average: 10752%
Pnote admin_down state: 0
Pnote Core Number state: 0
Policy time: 16777216
Interface states
Interfaces up in the Inbound: 0
Interfaces assumed up in the Inbound: 0
Interfaces up in the Outbound: 0
Interfaces assumed up in the Outbound: 0
Maybe it works fine if I have a real error 😉
Bye
- Mark as New
- Bookmark
- Subscribe
- Mute
- Subscribe to RSS Feed
- Permalink
- Report Inappropriate Content
Hi Daniel,
From the output I see you are running R77.30 in 64 bit mode (Protocol version 2921) and the member 1 is reporting it has an issue, I would check the status using “cphaprob list”
- Mark as New
- Bookmark
- Subscribe
- Mute
- Subscribe to RSS Feed
- Permalink
- Report Inappropriate Content
Hi Jason,
77.30 64 bit ist correct.
cphaprob -l list shows nothing special
# cphaprob -l list
Built-in Devices:
Device Name: Interface Active Check
Current state: OK
Device Name: Recovery Delay
Current state: OK
Registered Devices:
Device Name: Synchronization
Registration number: 0
Timeout: none
Current state: OK
Time since last report: 256189 sec
Device Name: Filter
Registration number: 1
Timeout: none
Current state: OK
Time since last report: 256184 sec
Device Name: routed
Registration number: 2
Timeout: none
Current state: OK
Time since last report: 130950 sec
Device Name: cphad
Registration number: 3
Timeout: 30 sec
Current state: OK
Time since last report: 2.23278e+06 sec
Process Status: UP
Device Name: fwd
Registration number: 4
Timeout: 30 sec
Current state: OK
Time since last report: 320680 sec
Process Status: UPAnd also cpstat shows also nothing special
# cpstat ha -f all |grep -v eth
Product name: High Availability
Major version: 6
Minor version: 0
Service pack: 4
Version string: N/A
Status code: 0
Status short: OK
Status long: Refer to the Notification and Interfaces tables for information about the problem
HA installed: 1
Working mode: High Availability (Active Up)
HA protocol version: 2
HA started: yes
HA state: active
HA identifier: 1
Interface table
-----------------------------------------------------------------------
|Name |IP |Status|Verified|Trusted|Shared|Netmask |
-----------------------------------------------------------------------
-----------------------------------------------------------------------Problem Notification table
------------------------------------------------
|Name |Status|Priority|Verified|Descr|
------------------------------------------------
|Synchronization|OK | 0| 256489| |
|Filter |OK | 0| 256484| |
|routed |OK | 0| 131249| |
|cphad |OK | 0| 2233077| |
|fwd |OK | 0| 320980| |
------------------------------------------------Cluster IPs table
-----------------------------------------------------------------------
|Name |IP |Netmask |Member Network|Member Netmask |
-----------------------------------------------------------------------
-----------------------------------------------------------------------Sync table
------------------------------------
|Name|IP |Netmask |
------------------------------------
------------------------------------
(I had to remove interfaces with IP-addresses)
- Mark as New
- Bookmark
- Subscribe
- Mute
- Subscribe to RSS Feed
- Permalink
- Report Inappropriate Content
fw ctl zdebug drop
fw monitor
tcpdump
- Mark as New
- Bookmark
- Subscribe
- Mute
- Subscribe to RSS Feed
- Permalink
- Report Inappropriate Content
fw stat
it shows which policy is installed. Some times it helps me to identify that firewall freezes with default filter or initial policy.
fw monitor -e "accept expression;"
- it helps me to understand what happens with packets. Do they return?
fw ctl zdebug drop | grep expression
- it helps to understand the reason of drop even if there is no log in SmartLog
cpview - it shows current throughput, packet rate and so on. very usefull
- Mark as New
- Bookmark
- Subscribe
- Mute
- Subscribe to RSS Feed
- Permalink
- Report Inappropriate Content
Thanks mate - brilliant
- Mark as New
- Bookmark
- Subscribe
- Mute
- Subscribe to RSS Feed
- Permalink
- Report Inappropriate Content
Below are some useful VSX Commands. Number after colon represents current virtual system (context) you are in.
FW-XXXX-01:0> show virtual-system all
Virtual systems list
VS ID VS NAME
0 0
1 FW-XXXX-01_VF-ABC-01
2 FW-XXXX-01_VF-XYZ-01
FW-XXXX-01:1> set virtual-system 2
Context is set to vsid 2
[Expert@FW-XXXX-01:0]# vsx stat
VSX Gateway Status
==================
Name: FW-XXX-01
Security Policy: FW-XYZ_VSX
Installed at: 18Oct2017 19:21:24
SIC Status: Trust
Number of Virtual Systems allowed by license: 10
Virtual Systems [active / configured]: 2 / 2
Virtual Routers and Switches [active / configured]: 0 / 0
Total connections [current / limit]: 24155 / 189700
[Expert@FW-XXXX-01:0]# vsenv 1
Context is set to Virtual Device FW-XXX-01_VF-XX-01 (ID 1).
vsx_util (from management box)
- Mark as New
- Bookmark
- Subscribe
- Mute
- Subscribe to RSS Feed
- Permalink
- Report Inappropriate Content
What is Checkpoint equivalent command for "show environment" ?
- Mark as New
- Bookmark
- Subscribe
- Mute
- Subscribe to RSS Feed
- Permalink
- Report Inappropriate Content
Rough equivalent to Cisco's show environment command is:
cpstat -f sensors os
cpstat -f power_supply os
--
My Book "Max Power: Check Point Firewall Performance Optimization"
Second Edition Coming Soon
New Book: "Max Power 2026" Coming Soon
Check Point Firewall Performance Optimization
Check Point Firewall Performance Optimization
- Mark as New
- Bookmark
- Subscribe
- Mute
- Subscribe to RSS Feed
- Permalink
- Report Inappropriate Content
Hi Tim,
Thanx for the reply,
When I issue "cpstat -f sensors os", it shows "STATUS 0". What is mean by STATUS 0 ?
- Mark as New
- Bookmark
- Subscribe
- Mute
- Subscribe to RSS Feed
- Permalink
- Report Inappropriate Content
Zero being reported by "cpstat -f sensors os" is good and means the voltage/temperature is within specifications. Anything other than zero (like 1) is bad and means something is out of spec.
--
My Book "Max Power: Check Point Firewall Performance Optimization"
Second Edition Coming Soon
New Book: "Max Power 2026" Coming Soon
Check Point Firewall Performance Optimization
Check Point Firewall Performance Optimization
- Mark as New
- Bookmark
- Subscribe
- Mute
- Subscribe to RSS Feed
- Permalink
- Report Inappropriate Content
One that I have not seen but is used mostly together with:
cplic print is the command:
contract_util mgmt
What is does is it forces the collection of the contract information from the management server.
Another that is very useful is indeed pinj
Next to that a very useful way to add pinj as a clish command is:
add command pinj path /opt/CPPinj-R77/pinj description "Packet Injector"
Regards, Maarten
- Mark as New
- Bookmark
- Subscribe
- Mute
- Subscribe to RSS Feed
- Permalink
- Report Inappropriate Content
pinj is a great tool to be sure, but does not currently work with R80.10 gateway. But hey sk110865: Check Point Packet Injector says that pinj will be available for R80.10 in 2017, so we should definitely have it here in the next 20 days or so. 🙂
tcptraceroute can be used in the meantime, but traffic created by that tool on the firewall only goes through oO, while pinj traffic goes through iIoO.
--
My Book "Max Power: Check Point Firewall Performance Optimization"
Second Edition Coming Soon
New Book: "Max Power 2026" Coming Soon
Check Point Firewall Performance Optimization
Check Point Firewall Performance Optimization
My Top 3 Check Point CLI commands
Just had a fun geeky conversation with Dameon Welch Abernathy (AKA Phoneboy) Jony Fischbein , Jeff Schwartz and Michael Poublon (over 100 accumulated years of experience in Check Point products) , on what are our favorite & most useful commands in a Check Point environment.
Below are my 3 , plz add yours in the comments (we will do a poll for the top 5 after getting your feedback ... ).
1) fw ctl zdebug drop
used to quickly see all dropped connections and more importantly the reason (e.g. anti-spoofing, IPS , FW rule , ....)
2) cpstat fw
quickly see stats of number of connections (accepted,denied,logged) with a breakdown
if the FW was under a high load i would usually run " watch --interval=1 'cpstat fw' " (would see a real-time to see the interface that is causing this)

3) fw tab -s -t connections
allowed me to quickly see how much load is (and was i.e "peak" ) on the FW

that's it (i have more , but i want to hear yours ...)
plz add yours in the comments (we will do a poll for the top 5 after getting your feedback ... )
Leaderboard
Epsum factorial non deposit quid pro quo hic escorol.
| User | Count |
|---|---|
| 12 | |
| 5 | |
| 4 | |
| 3 | |
| 3 | |
| 3 | |
| 2 | |
| 1 | |
| 1 | |
| 1 |
Upcoming Events
Tue 14 Jul 2026 @ 10:00 AM (PDT)
AI Security Masters E11: READY OR NOT: Securing the AI Enterprise 3/5 - AI Workforce SecurityThu 30 Jul 2026 @ 10:00 AM (PDT)
AI Security Masters E12: READY OR NOT: Securing the AI Enterprise 4/5 - AI GatewayThu 20 Aug 2026 @ 10:00 AM (PDT)
AI Security Masters E13: READY OR NOT: Securing the AI Ent 5/5 - AI Research & Threat LandscapeTue 14 Jul 2026 @ 10:00 AM (PDT)
AI Security Masters E11: READY OR NOT: Securing the AI Enterprise 3/5 - AI Workforce SecurityThu 30 Jul 2026 @ 10:00 AM (PDT)
AI Security Masters E12: READY OR NOT: Securing the AI Enterprise 4/5 - AI GatewayThu 20 Aug 2026 @ 10:00 AM (PDT)
AI Security Masters E13: READY OR NOT: Securing the AI Ent 5/5 - AI Research & Threat LandscapeAbout CheckMates
Learn Check Point
Advanced Learning
YOU DESERVE THE BEST SECURITY

©1994-2026 Check Point Software Technologies Ltd. All rights reserved.
Copyright
Privacy Policy
About Us
UserCenter