Hello nice to meet you
Recently, a customer's firewall has lost its service connection due to an increase in resources for an unknown reason.
And I don't know if it is related to resource increase or service disconnection, but the message below will be generated every time there is an issue.
I saw something similar to this in 'sk167939', but the customer is a completely different version from the DB version specified in sk.
In addition, TAC said that there are no bugs in DB versions other than those specified in SK.
I am wondering if that message has anything to do with increasing resource usage.
Symptoms and messages are the same for the two devices specified below.
* Model: SG23800
* Version: R80.40 (VRRP)
* Blade: Firewall / IPS
* CPU: 48Core (H/T on)
* Memory: 32G
* Model: SG15600
* Version: R80.10 (VRRP)
* Blade: Firewall / IPS
* CPU: 32 Core(H/T on)
* Memory: 16G
Jan 7 07:45:03 2021 LGESA_GW_FW1 kernel: [fw4_1];CLUS-120202-1: Stopping CUL mode after 11 sec (short CUL timeout), because no member reported CPU usage above the configured threshold (80%) during the last 10 sec.
Jan 7 07:47:18 2021 LGESA_GW_FW1 kernel: [fw4_1];CLUS-120200-1: Starting CUL mode because CPU-04 usage (84%) on the local member increased above the configured threshold (80%).
Jan 7 07:47:18 2021 LGESA_GW_FW1 kernel: [fw4_39];ips_gen_dyn_log: malware_policy_global_send_log() failed
Jan 7 07:47:18 2021 LGESA_GW_FW1 kernel: [fw4_14];ips_gen_dyn_log: malware_policy_global_send_log() failed
Jan 7 07:47:18 2021 LGESA_GW_FW1 kernel: [fw4_13];ips_gen_dyn_log: malware_policy_global_send_log() failed
Jan 7 07:47:18 2021 LGESA_GW_FW1 kernel: [fw4_4];ips_gen_dyn_log: malware_policy_global_send_log() failed
Jan 7 07:47:18 2021 LGESA_GW_FW1 kernel: [fw4_8];ips_gen_dyn_log: malware_policy_global_send_log() failed
Jan 7 07:47:18 2021 LGESA_GW_FW1 kernel: [fw4_0];fwmultik_prio_handle_gconn_lookup: failed getting instance section from connection 40.90.4.201(53) -> 156.147.135.180(52007) IPP 17 instance 29
Jan 7 07:47:18 2021 LGESA_GW_FW1 kernel: [fw4_0];fwmultik_enqueue_data_kernel: error in gconn lock and lookup. cannot enqueue to priority queues. (instance 29, opcode:6)
Jan 7 07:47:18 2021 LGESA_GW_FW1 kernel: [fw4_32];ips_gen_dyn_log: malware_policy_global_send_log() failed
Jan 7 07:47:18 2021 LGESA_GW_FW1 kernel: [fw4_39];ips_gen_dyn_log: malware_policy_global_send_log() failed
Jan 7 07:47:18 2021 LGESA_GW_FW1 kernel: [fw4_2];ips_gen_dyn_log: malware_policy_global_send_log() failed
Jan 7 07:47:18 2021 LGESA_GW_FW1 kernel: [fw4_17];ips_gen_dyn_log: malware_policy_global_send_log() failed
Jan 7 07:47:18 2021 LGESA_GW_FW1 kernel: [fw4_8];ips_gen_dyn_log: malware_policy_global_send_log() failed
Jan 7 07:47:18 2021 LGESA_GW_FW1 kernel: [fw4_9];ips_gen_dyn_log: malware_policy_global_send_log() failed
Jan 7 07:47:18 2021 LGESA_GW_FW1 kernel: [fw4_14];ips_gen_dyn_log: malware_policy_global_send_log() failed
Jan 7 07:47:18 2021 LGESA_GW_FW1 last message repeated 2 times
Jan 7 07:47:18 2021 LGESA_GW_FW1 kernel: [fw4_1];ips_gen_dyn_log: malware_policy_global_send_log() failed
Jan 7 07:47:18 2021 LGESA_GW_FW1 kernel: FW-1: lost 2107 debug messages
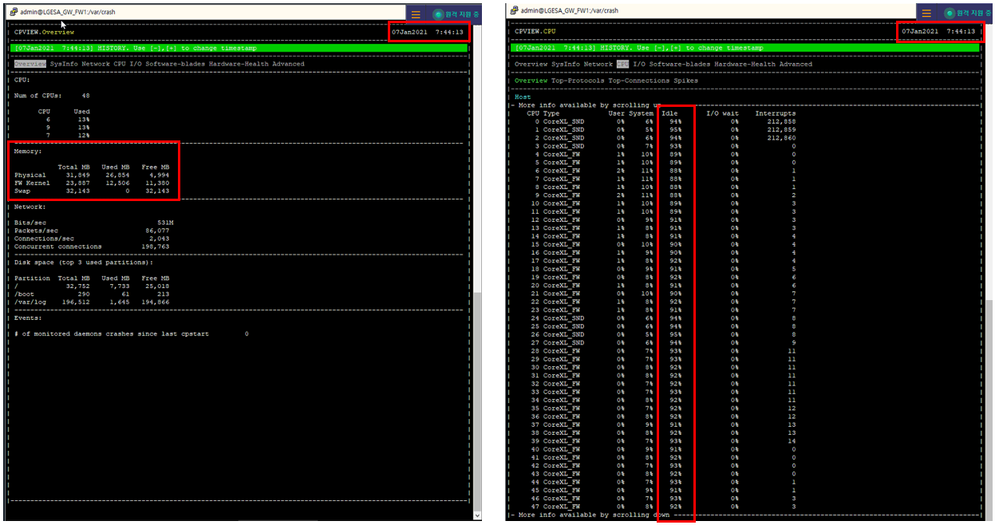
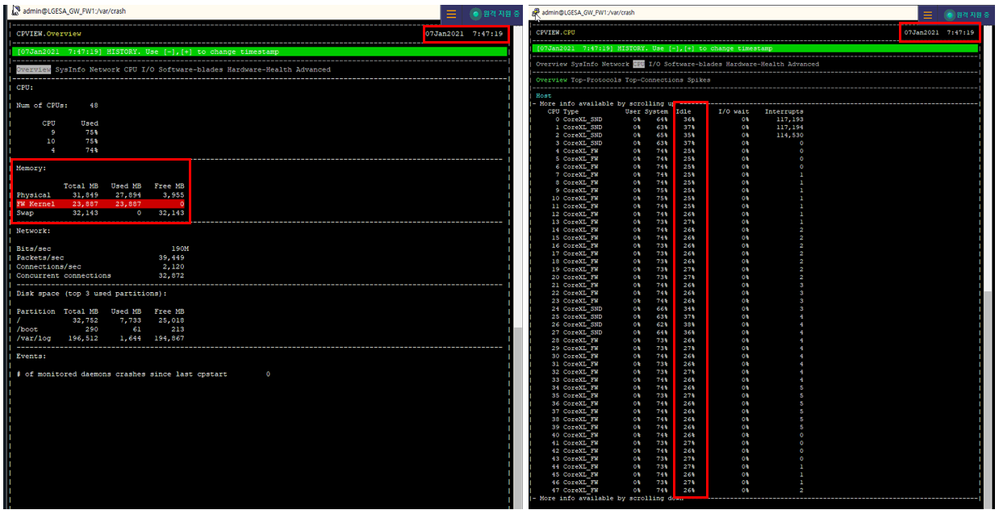
PS This is the status information of the customer firewall at the time of the failure.
1. From 07:44 to 07:47, cpview data did not accumulate for about 3 minutes.
2. The cpu and memory usage of 47 minutes is very high compared to 44 minutes.
3. At that time, aggressive aging was activated.


