Hi Valeri,
Thanks for your reply.
Please see below a complete chunk of those messages:
Aug 17 09:04:52 2018 XXXXXXXXXXXXX kernel: [fw4_1];FW-1: [cul_load_freeze][CUL - Cluster] CUL_CLUSTER is FREEZE_ON and should stay ON, updating time, kernel CPU usage [83%]
Aug 17 09:04:52 2018 XXXXXXXXXXXXX kernel: [fw4_1];FW-1: [cul_load_freeze][CUL - Cluster] CUL should be OFF (short timeout of 10 seconds expired) but at least one member reported high CPU usage 0 sec
onds ago
Aug 17 09:04:54 2018 XXXXXXXXXXXXX last message repeated 2 times
Aug 17 09:04:55 2018 XXXXXXXXXXXXX kernel: [fw4_1];FW-1: [cul_load_freeze][CUL - Cluster] CUL_CLUSTER is FREEZE_ON and should stay ON, updating time, kernel CPU usage [82%]
Aug 17 09:04:55 2018 XXXXXXXXXXXXX kernel: [fw4_1];FW-1: [cul_load_freeze][CUL - Cluster] CUL should be OFF (short timeout of 10 seconds expired) but at least one member reported high CPU usage 0 sec
onds ago
Aug 17 09:04:56 2018 XXXXXXXXXXXXX kernel: [fw4_1];FW-1: [cul_load_freeze][CUL - Cluster] CUL should be OFF (short timeout of 10 seconds expired) but at least one member reported high CPU usage 1 sec
onds ago
Aug 17 09:04:57 2018 XXXXXXXXXXXXX kernel: [fw4_1];FW-1: [cul_load_freeze][CUL - Cluster] CUL should be OFF (short timeout of 10 seconds expired) but at least one member reported high CPU usage 0 sec
onds ago
Aug 17 09:04:58 2018 XXXXXXXXXXXXX kernel: [fw4_1];FW-1: [cul_load_freeze][CUL - Cluster] CUL should be OFF (short timeout of 10 seconds expired) but at least one member reported high CPU usage 0 sec
onds ago
Aug 17 09:04:59 2018 XXXXXXXXXXXXX kernel: [fw4_1];FW-1: [cul_load_freeze][CUL - Cluster] CUL should be OFF (short timeout of 10 seconds expired) but at least one member reported high CPU usage 1 sec
onds ago
Aug 17 09:05:00 2018 XXXXXXXXXXXXX kernel: [fw4_1];FW-1: [cul_load_freeze][CUL - Cluster] CUL should be OFF (short timeout of 10 seconds expired) but at least one member reported high CPU usage 0 sec
onds ago
Aug 17 09:05:01 2018 XXXXXXXXXXXXX kernel: [fw4_1];FW-1: [cul_load_freeze][CUL - Cluster] CUL should be OFF (short timeout of 10 seconds expired) but at least one member reported high CPU usage 0 sec
onds ago
Aug 17 09:05:02 2018 XXXXXXXXXXXXX kernel: [fw4_1];FW-1: [cul_load_freeze][CUL - Cluster] CUL should be OFF (short timeout of 10 seconds expired) but at least one member reported high CPU usage 1 sec
onds ago
Aug 17 09:05:03 2018 XXXXXXXXXXXXX kernel: [fw4_1];FW-1: [cul_load_freeze][CUL - Cluster] CUL should be OFF (short timeout of 10 seconds expired) but at least one member reported high CPU usage 0 sec
onds ago
Aug 17 09:05:04 2018 XXXXXXXXXXXXX kernel: [fw4_1];FW-1: [cul_load_freeze][CUL - Cluster] CUL should be OFF (short timeout of 10 seconds expired) but at least one member reported high CPU usage 0 sec
onds ago
Aug 17 09:05:05 2018 XXXXXXXXXXXXX kernel: [fw4_1];FW-1: [cul_load_freeze][CUL - Cluster] CUL should be OFF (short timeout of 10 seconds expired) but at least one member reported high CPU usage 1 sec
onds ago
Aug 17 09:05:06 2018 XXXXXXXXXXXXX kernel: [fw4_1];FW-1: [cul_load_freeze][CUL - Cluster] CUL should be OFF (short timeout of 10 seconds expired) but at least one member reported high CPU usage 2 sec
onds ago
Aug 17 09:05:07 2018 XXXXXXXXXXXXX kernel: [fw4_1];FW-1: [cul_load_freeze][CUL - Cluster] CUL should be OFF (short timeout of 10 seconds expired) but at least one member reported high CPU usage 0 sec
onds ago
Aug 17 09:05:08 2018 XXXXXXXXXXXXX kernel: [fw4_1];FW-1: [cul_load_freeze][CUL - Cluster] CUL should be OFF (short timeout of 10 seconds expired) but at least one member reported high CPU usage 1 sec
onds ago
Aug 17 09:05:09 2018 XXXXXXXXXXXXX kernel: [fw4_1];FW-1: [cul_load_freeze][CUL - Cluster] CUL should be OFF (short timeout of 10 seconds expired) but at least one member reported high CPU usage 2 sec
onds ago
Aug 17 09:05:10 2018 XXXXXXXXXXXXX kernel: [fw4_1];FW-1: [cul_load_freeze][CUL - Cluster] CUL should be OFF (short timeout of 10 seconds expired) but at least one member reported high CPU usage 3 sec
onds ago
Aug 17 09:05:11 2018 XXXXXXXXXXXXX kernel: [fw4_1];FW-1: [cul_load_freeze][CUL - Cluster] CUL should be OFF (short timeout of 10 seconds expired) but at least one member reported high CPU usage 4 sec
onds ago
Aug 17 09:05:12 2018 XXXXXXXXXXXXX kernel: [fw4_1];FW-1: [cul_load_freeze][CUL - Cluster] CUL should be OFF (short timeout of 10 seconds expired) but at least one member reported high CPU usage 5 sec
onds ago
Aug 17 09:05:13 2018 XXXXXXXXXXXXX kernel: [fw4_1];FW-1: [cul_load_freeze][CUL - Cluster] CUL should be OFF (short timeout of 10 seconds expired) but at least one member reported high CPU usage 6 sec
onds ago
Aug 17 09:05:14 2018 XXXXXXXXXXXXX kernel: [fw4_1];FW-1: [cul_load_freeze][CUL - Cluster] CUL should be OFF (short timeout of 10 seconds expired) but at least one member reported high CPU usage 7 sec
onds ago
Aug 17 09:05:15 2018 XXXXXXXXXXXXX kernel: [fw4_1];FW-1: [cul_load_freeze][CUL - Cluster] CUL should be OFF (short timeout of 10 seconds expired) but at least one member reported high CPU usage 8 sec
onds ago
Aug 17 09:05:16 2018 XXXXXXXXXXXXX kernel: [fw4_1];FW-1: [cul_load_freeze][CUL - Cluster] CUL should be OFF (short timeout of 10 seconds expired) but at least one member reported high CPU usage 9 sec
onds ago
Aug 17 09:05:16 2018 XXXXXXXXXXXXX kernel: [fw4_1];FW-1: [cul_load_freeze][CUL - Cluster] Changing CUL state to OFF, no Member reported high CPU usage for the past 10 seconds, CUL was ON for 71 secon
ds
---------------------------------------------------------------###############--------------------------------------------------------------------
From our investigations from cpview history we found that probably is core #15 reaching over 80%, this core is assigned to Firewall Instance 0
fw ctl affinity -l
Mgmt: CPU 1
Sync: CPU 2
eth1-01: CPU 0
eth2-04: CPU 1
eth3-01: CPU 3
eth3-02: CPU 2
eth3-04: CPU 3
Kernel fw_0: CPU 15
Kernel fw_1: CPU 14
Kernel fw_2: CPU 13
Kernel fw_3: CPU 12
Kernel fw_4: CPU 11
Kernel fw_5: CPU 10
Kernel fw_6: CPU 9
Kernel fw_7: CPU 8
Kernel fw_8: CPU 7
Kernel fw_9: CPU 6
Kernel fw_10: CPU 5
Kernel fw_11: CPU 4
Daemon fwd: CPU 4 5 6 7 8 9 10 11 12 13 14 15
Daemon mpdaemon: CPU 4 5 6 7 8 9 10 11 12 13 14 15
Daemon lpd: CPU 4 5 6 7 8 9 10 11 12 13 14 15
Daemon pepd: CPU 4 5 6 7 8 9 10 11 12 13 14 15
Daemon pdpd: CPU 4 5 6 7 8 9 10 11 12 13 14 15
Daemon cpd: CPU 4 5 6 7 8 9 10 11 12 13 14 15
Daemon cprid: CPU 4 5 6 7 8 9 10 11 12 13 14 15
Interface eth2-01: has multi queue enabled
Interface eth2-02: has multi queue enabled
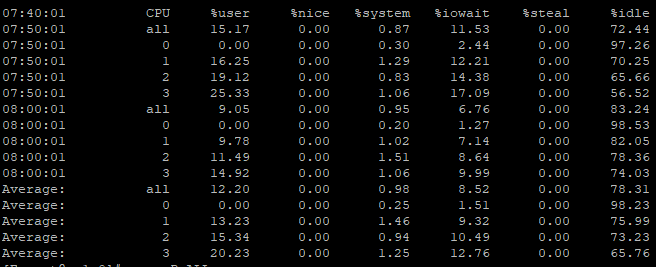
The problem here is that from 2 days ago until now we don't find anything in our env. that can justify the appearence of these spikes.
We have now a close monitoring on all cores utilization to check if the occurence of these messages are correlated with real core usage, since we had start this close monitoring the issue didn't happen again 
Many Thanks,
