Create a Post
cancel
Showing results for 
Search instead for 
Did you mean: 
Exonix
Advisor
Jump to solution

one GW doesn't send logs

Hello all,

we have two Security GW and One Management Server R81.10. All virtuallized. Recently I found that one GW doesn't send any logs, there is no any problem with second GW. The information I've got:

netstat -na | grep  257
tcp        0      0 0.0.0.0:257                 0.0.0.0:*                   LISTEN
tcp        0      0 10.80.0.115:257             10.80.0.113:61789           ESTABLISHED
tcp        0      0 10.80.0.115:257             10.80.0.114:63790           ESTABLISHED

it takes longer time to see tcpdump output for problematic GW than for working GW (for working GW the output comes immediately)

 tcpdump -i any host 10.80.0.114 and port 257 -nn
tcpdump: verbose output suppressed, use -v or -vv for full protocol decode
listening on any, link-type LINUX_SLL (Linux cooked), capture size 262144 bytes
10:17:54.903439 IP 10.80.0.114.63790 > 10.80.0.115.257: Flags [P.], seq 3252758247:3252759157, ack 1283986478, win 40, options [nop,nop,TS val 3875119068 ecr 3877208555], length 910
10:17:54.903463 IP 10.80.0.115.257 > 10.80.0.114.63790: Flags [.], ack 910, win 174, options [nop,nop,TS val 3877227408 ecr 3875119068], length 0
^C
2 packets captured
2 packets received by filter
0 packets dropped by kernel

 Management Server:

 cpstat mg -f log_server

Log Receive Rate:                 23
Log Receive Rate Peak:            211466
Log Receive Rate Last 10 Minutes: 28
Log Receive Rate Last Hour:       27


Log Server Connected Gateways
-------------------------------------------------------------------
|Name         |State    |Last Login Time         |Log Receive Rate|
-------------------------------------------------------------------
|Local Clients|Connected|N/A                     |               0|
|----fw02     |Connected|Thu Feb 23 05:42:48 2023|               0|
|----fw01     |Connected|Tue Feb 22 14:45:11 2022|              22|
-------------------------------------------------------------------


 Why Security Gateway 10.80.0.114 doesn't send any logs?

cpstat fw -f log_connection

Overall Status:                 0
Overall Status Description:     Security Gateway is reporting logs as defined
Local Logging Mode Description: Logs are written to log server
Local Logging Mode Status:      0
Local Logging Sending Rate:     0
Log Handling Rate:              0


Log Servers Connections
------------------------------------------------------
|IP         |Status|Status Description  |Sending Rate|
------------------------------------------------------
|10.80.0.115|     0|Log-Server Connected|           0|
------------------------------------------------------

Thank you!

0 Kudos
1 Solution

Accepted Solutions
Exonix
Advisor

rebooting helped:


Log Server Connected Gateways
-------------------------------------------------------------------
|Name         |State    |Last Login Time         |Log Receive Rate|
-------------------------------------------------------------------
|Local Clients|Connected|N/A                     |               0|
|----fw02     |Connected|Wed Mar 22 19:02:29 2023|              37|
|----fw01     |Connected|Tue Feb 22 14:45:11 2022|              10|
-------------------------------------------------------------------


View solution in original post

0 Kudos
9 Replies
Tal_Paz-Fridman
Employee
Employee

Please check sk146112 Security Gateway does not send logs to the Log Server configured in its object:

https://supportcenter.checkpoint.com/supportcenter/portal?eventSubmit_doGoviewsolutiondetails=&solut...


Also, is the FWD process on the gateway working properly - working without being under heavy load?

Exonix
Advisor

Hello Tal_Paz-Fridman,

I also checked  $FWDIR/conf/masters - it has same properties and content on both GW:


[Expert@----fw02:0]# cat $FWDIR/conf/masters
[Policy]
----fm01
[Log]
----fm01
[Alert]
----fm01
[Expert@----fw02:0]# lsattr $FWDIR/conf/masters
---------------- /opt/CPsuite-R81.10/fw1/conf/masters


[Expert@----fw01:0]# cat $FWDIR/conf/masters
[Policy]
----fm01
[Log]
----fm01
[Alert]
----fm01
[Expert@----fw01:0]# lsattr $FWDIR/conf/masters
---------------- /opt/CPsuite-R81.10/fw1/conf/masters


moreover I went through all steps here: Troubleshooting Check Point logging issues when Security Management Server / Log Server is not recei... but nothig helped. Is there something suspicious in this output?


fw_ciu_conf_get: start app Application Control _attr appi_urlf_enabled
log_debug_sig_handler: got command: data_str: (1), env_str: (TDERROR_ALL_FWLOG_DISPATCH=5)
[FWD 17765 3943544832]@----fw02[21 Mar 16:56:02] Starting debug output
[FWD 17765 3943544832]@----fw02[21 Mar 16:56:02] Setting TDERROR
[FWD 17765 3943544832]@----fw02[21 Mar 16:56:07] addLocalSendRateToStatus: succeeded to write server send rate. server send rate is 0
[FWD 17765 3943544832]@----fw02[21 Mar 16:56:07] addLocalSendRateToStatus: succeeded to write server send rate. server send rate is 0
[FWD 17765 3943544832]@----fw02[21 Mar 16:56:07] addLocalSendRateToStatus: succeeded to write local rates. local write rate is 0, local handle rate is 0
[FWD 17765 3943544832]@----fw02[21 Mar 16:56:17] addLocalSendRateToStatus: succeeded to write server send rate. server send rate is 0
[FWD 17765 3943544832]@----fw02[21 Mar 16:56:17] addLocalSendRateToStatus: succeeded to write server send rate. server send rate is 0
[FWD 17765 3943544832]@----fw02[21 Mar 16:56:17] addLocalSendRateToStatus: succeeded to write local rates. local write rate is 0, local handle rate is 0
[FWD 17765 3943544832]@----fw02[21 Mar 16:56:27] addLocalSendRateToStatus: succeeded to write server send rate. server send rate is 0
[FWD 17765 3943544832]@----fw02[21 Mar 16:56:27] addLocalSendRateToStatus: succeeded to write server send rate. server send rate is 0
[FWD 17765 3943544832]@----fw02[21 Mar 16:56:27] addLocalSendRateToStatus: succeeded to write local rates. local write rate is 0, local handle rate is 0
log_debug_sig_handler: got command: data_str: (2), env_str: (TDERROR_ALL_FWLOG_DISPATCH=0)
Stop debug output - was already off
fw_ciu_conf_get: start app Application Control _attr appi_enabled
fw_ciu_conf_get: start app Application Control _attr appi_urlf_enabled


0 Kudos
Exonix
Advisor

regarding FWD - don't think it is overloaded. each VM has 2 vCPU (16-30% is consumed), 8 GB RAM (3 GB in use). How can I check whether it is overloaded?

Addtional info: problem GW has direkt access to the Internet, working GW is for internal purposes only. And what I don't like that IPS has over 500k attaks detected... I tried to find how many attaks pro minute, but logging stopped working a month ago...

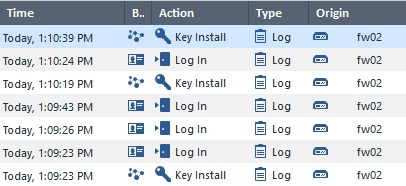
and more info: from time to time we can see Key Install and Log in logs:

logs111.png

0 Kudos
Tal_Paz-Fridman
Employee
Employee

Over what period of time were the 500K IPS attacks detected?

When you run dmesg on the Gateway does it show at the end of the output any errors that might be related to logging?

0 Kudos
Exonix
Advisor

I don't know for what period it is. This is displayed in GAIA, but at the same time, we have a more powerful and loaded firewall, which has only 50k.

from 1 May 2022 dmesg shows only this:

[Mon Feb 20 15:06:00 2023] fw_full[17602]: segfault at cf2101d8 ip 00000000f62c5813 sp 00000000ffd86160 error 4 in libCPLogRepository.so[f6247000+ca000]
[Tue Feb 21 10:28:36 2023] fw_full[17375]: segfault at cd7126ec ip 00000000f6332813 sp 00000000ffa4e4d0 error 4 in libCPLogRepository.so[f62b4000+ca000]
[Tue Feb 21 11:51:58 2023] fw_full[5160]: segfault at ce403a24 ip 00000000f629a813 sp 00000000fffb5020 error 4 in libCPLogRepository.so[f621c000+ca000]
[Tue Feb 21 13:13:24 2023] fw_full[29883]: segfault at d021359c ip 00000000f6286813 sp 00000000fff2af40 error 4 in libCPLogRepository.so[f6208000+ca000]
[Tue Feb 21 13:31:29 2023] fw_full[8499]: segfault at d3419b88 ip 00000000f62a5813 sp 00000000fff90a80 error 4 in libCPLogRepository.so[f6227000+ca000]
[Wed Feb 22 10:33:35 2023] fw_full[14767]: segfault at cf20f450 ip 00000000f62ed813 sp 00000000ffb57200 error 4 in libCPLogRepository.so[f626f000+ca000]
[Wed Feb 22 11:12:56 2023] fw_full[30128]: segfault at d02046c0 ip 00000000f631b813 sp 00000000ffe0d0c0 error 4 in libCPLogRepository.so[f629d000+ca000]
[Wed Feb 22 14:20:50 2023] fw_full[9884]: segfault at cee06b94 ip 00000000f62c7813 sp 00000000ffc97960 error 4 in libCPLogRepository.so[f6249000+ca000]
[Thu Feb 23 00:00:28 2023] fw_full[18590]: segfault at ce104a44 ip 00000000f6355813 sp 00000000fff82830 error 4 in libCPLogRepository.so[f62d7000+ca000]
[Thu Feb 23 00:20:54 2023] fw_full[16013]: segfault at cfce9fb0 ip 00000000f62aca26 sp 00000000ffd31a70 error 4 in libCPLogRepository.so[f6229000+ca000]
[Thu Feb 23 00:22:27 2023] fw_full[26931]: segfault at d38d480c ip 00000000f62a1813 sp 00000000ffcbac50 error 4 in libCPLogRepository.so[f6223000+ca000]
[Thu Feb 23 00:59:14 2023] fw_full[28995]: segfault at d300cbac ip 00000000f62b8813 sp 00000000ff9bb7a0 error 4 in libCPLogRepository.so[f623a000+ca000]
[Thu Feb 23 01:35:44 2023] fw_full[29267]: segfault at d3a081c0 ip 00000000f632b813 sp 00000000ffbde680 error 4 in libCPLogRepository.so[f62ad000+ca000]
[Thu Feb 23 02:28:43 2023] fw_full[8364]: segfault at cfa184a0 ip 00000000f629c813 sp 00000000ffd6a9d0 error 4 in libCPLogRepository.so[f621e000+ca000]
[Thu Feb 23 02:59:17 2023] fw_full[24443]: segfault at d0601b60 ip 00000000f6302813 sp 00000000ffad65e0 error 4 in libCPLogRepository.so[f6284000+ca000]
[Thu Feb 23 03:22:28 2023] fw_full[1734]: segfault at cfe62bc8 ip 00000000f635aa26 sp 00000000ffb10530 error 4 in libCPLogRepository.so[f62d7000+ca000]
[Thu Feb 23 03:33:30 2023] fw_full[9433]: segfault at cff5a478 ip 00000000f62a4813 sp 00000000ff8c3e00 error 4 in libCPLogRepository.so[f6226000+ca000]

 what does mean fw_full?

df -kh
Filesystem                       Size  Used Avail Use% Mounted on
/dev/mapper/vg_splat-lv_current   32G  8.9G   24G  28% /
/dev/sda1                        291M   27M  249M  10% /boot
tmpfs                            3.8G  9.9M  3.8G   1% /dev/shm
/dev/mapper/vg_splat-lv_log       32G  8.0G   25G  25% /var/log


0 Kudos
Tal_Paz-Fridman
Employee
Employee

fw_full is just another process used by fwd:

"fw" process and/or "fw_full" process, which are just wrappers for the "fwd" process. (sk97638)

So there might be an issue here with FWD - all the cores suggest that as they also refer to the file 

libCPLogRepository.so

I would contact TAC to look at the issue


Exonix
Advisor

we will restart the server, and then contact TAC. Thank you for your help.

0 Kudos
Tal_Paz-Fridman
Employee
Employee

If that's an option that would be great.

Exonix
Advisor

rebooting helped:


Log Server Connected Gateways
-------------------------------------------------------------------
|Name         |State    |Last Login Time         |Log Receive Rate|
-------------------------------------------------------------------
|Local Clients|Connected|N/A                     |               0|
|----fw02     |Connected|Wed Mar 22 19:02:29 2023|              37|
|----fw01     |Connected|Tue Feb 22 14:45:11 2022|              10|
-------------------------------------------------------------------


0 Kudos

Leaderboard

Epsum factorial non deposit quid pro quo hic escorol.

Upcoming Events

    CheckMates Events