Create a Post
cancel
Showing results for 
Search instead for 
Did you mean: 
T_Sonnberger
Contributor
Jump to solution

Understanding fw ctl conntab / Issues with Jenkins after introducing firewall

Dear CheckMates,


we have an issue with our Jenkins farm since we have introduced a new security group into our internal networks.

Every now and then our devs complain that they lose the connection to some Jenkins Agents.


After some research on the firewall, we have seen that the Jenkins Master has sent an "ACK" after 12hours.

Upon this, we have set the session timeout to 24h and did some further checks, realizing that actually the session gets refreshed frequently

<(inbound, src=[10.*.*.*,51889], dest=[10.*.*.*,50001], TCP); 86070/86392, rule=45, tcp state=TCP_ESTABLISHED, service=514, Ifncin=157, Ifnsin=235, conn modules: , Authentication, FG-1>


The timer never fell below 85000 seconds. However, the latest "drop" was when the Jenkins Master has sent the "ACK" after more than 48h!

We then have had a discussion with the devs and he changed a setting, which removed some tunneling functionality and the fw ctl conntab changed:

<(inbound, src=[10.*.*.*,62532], dest=[10.*.*.*,50001], TCP); 86262/86357, rule=45, tcp state=TCP_ESTABLISHED, service=514, Ifncin=157


There no longer is a "Ifnsin=235" parameter.


Unfortunately, I was not able to find a proper documetation, explaining what these parameters mean, so could anyone please help us, with the meaning of Ifnsin=235 and Ifncin=157?


Thank you very much in advance and Best Regards,

Thomas


1 Solution

Accepted Solutions
T_Sonnberger
Contributor

I just wanted to share an update.

The Jenkins team hast done some optimizations on the "Master VM" as well as configuring some "performance optimization" parameters on the agents. 

After these changes, the CPU Wait time on the Jenkins Master decreased from 60% - 80%  down to < 10% and since then, the agents do not loose the connections anymore.

It appears, that the disconnect happened due to an overloaded master server and the "reconnecte" failed  because the agents use an old session for the retry, which is blocked on the firewall then.

In the end, the firewall does not cause the connection loss, but only prevents the reconnect - which is due to bad network behaviour of Jenkins (imo).


Thank you all for your support!

View solution in original post

7 Replies
the_rock
Legend
Legend

Hey @T_Sonnberger ...seems like you did an excellent job investigating this, so kudos to you! I have some questions...

1) You seem to indicate this happened with introcution of new security group. Were there any other changes done as far as security rules?

2) If you do basic zdebug, are you able to see any drops to related/affected IP addresses/services?

3) Have you attempted to do fw monitor -F flag command to confirm the behavior? Idea is this...fw monitor -F "srcip, srcport, dstip,dstport,protocol" -F "srcip,srcport,dstip,dstport,protocol"

example, say src is 1.1.1.1 and dst is 2.2.2.2 and port is 443

fw monitor -F "1.1.1.1,0,2.2.2.2,443,0" -F "2.2.2.2,0,1.1.1.1,443,0"

Hope that helps.

Andy

0 Kudos
T_Sonnberger
Contributor

Hi @the_rock 

Thank you very much for the reply.

To answer your questions:

1) No further changes were introduced. The ruleset on the new firewall is currently more or less "any any allow"

The security group will seperate our internal server networks and currently we are in "monitor mode" to be able to build rules based on the traffic patterns.  


2) I do not see any drops with fwctl zdebug or in smart log. Maybe it's worth to mention, that it is the destination that sends the "ACK" as an answer days after the initial setup of the session.

The latest example is:

28th Feb - 7:14:31 AM - Client A:65226 - Server B:50001

Today, 3:16:41 AM Server B:50001 - Client A:65226 - First Packet isn't syn (ACK)


Issuing the fw monitor command shows that currently there is frequent traffic flowing between two partners


[vs_0][ppak_0] bond1.client-side:i[64]: Client A -> Server B (TCP) len=80 id=6722
TCP: 49740 -> 50001 ...PA. seq=631a938d ack=8da45db9
[vs_0][ppak_0] bond1.client-side:I[64]: Client A -> Server B (TCP) len=80 id=6722
TCP: 49740 -> 50001 ...PA. seq=631a938d ack=8da45db9
[vs_0][ppak_0] bond1.server-side:o[64]: Client A -> Server B (TCP) len=80 id=6722
TCP: 49740 -> 50001 ...PA. seq=631a938d ack=8da45db9
[vs_0][ppak_0] bond1.server-side:O[64]: Client A -> Server B (TCP) len=80 id=6722
TCP: 49740 -> 50001 ...PA. seq=631a938d ack=8da45db9
[vs_0][ppak_0] bond1.client-side:i[64]: Client A -> Server B (TCP) len=1500 id=6723
TCP: 49740 -> 50001 ....A. seq=631a93b5 ack=8da45db9
[vs_0][ppak_0] bond1.client-side:I[64]: Client A -> Server B (TCP) len=1500 id=6723
TCP: 49740 -> 50001 ....A. seq=631a93b5 ack=8da45db9
[vs_0][ppak_0] bond1.server-side:o[64]: Client A -> Server B (TCP) len=1500 id=6723
TCP: 49740 -> 50001 ....A. seq=631a93b5 ack=8da45db9
[vs_0][ppak_0] bond1.server-side:O[64]: Client A -> Server B (TCP) len=1500 id=6723
TCP: 49740 -> 50001 ....A. seq=631a93b5 ack=8da45db9
[vs_0][ppak_0] bond1.client-side:i[64]: Client A -> Server B (TCP) len=283 id=6724
TCP: 49740 -> 50001 ...PA. seq=631a9969 ack=8da45db9
[vs_0][ppak_0] bond1.client-side:I[64]: Client A -> Server B (TCP) len=283 id=6724
TCP: 49740 -> 50001 ...PA. seq=631a9969 ack=8da45db9
[vs_0][ppak_0] bond1.server-side:o[64]: Client A -> Server B (TCP) len=283 id=6724
TCP: 49740 -> 50001 ...PA. seq=631a9969 ack=8da45db9
[vs_0][ppak_0] bond1.server-side:O[64]: Client A -> Server B (TCP) len=283 id=6724
TCP: 49740 -> 50001 ...PA. seq=631a9969 ack=8da45db9


Is there a way to add timestamps to fw monitor and send it to a file? So we could maybe see if the traffic flow stops at some time?


Thanks in advance!

BR,

Thomas


0 Kudos
the_rock
Legend
Legend

Hey Thomas,

[Expert@quantum-firewall:0]# fw monitor -h
Usage: fw monitor
[-o <file name>] [-l len] [-w whole packet] [-u|s uuid] [-b <buffer size in Kbytes>]
[-F simple filter "<src IP>,<src port>,<dst IP>,<dst port>,<protocol num>"]
[-U unload] [-T timestamp] [-x offset[,len]] [-D|d debug mode] [-i flush stdout]
[-v VS] [m mask <i,I,o,O,e,E>]
<{-e expr}+|-f <filter-file|->>
<[-pi pos] [-pI pos] [-po pos] [-pO pos] | -p all [-a]>
[-ci count] [-co count]

[Expert@quantum-firewall:0]#

You can do -T flag for timestamps 🙂

Andy

0 Kudos
T_Sonnberger
Contributor

Hi Andy,


thanks for the reply and apologies for the late response...


I have investigated further and it appears, that the "out of state" drop is rather a symptom of the disconnect than the reason.

I have compared several drops with the timestamps of the server logs.

At the exact time, when the disconnects happen, I see the creation of a new session in smart log, while the "out of state" drop of an old session happens always approx 2-3 Minutes later.


So we were thinking if it might be the exhaustion of a connection limit. Is there any limit regarding a certain client to server connection and if so, how can you check it?

Or is there only the overall connection limit, which seems to be fine:

[Expert@vistradpsg01-ch01-02:0]# fw ctl pstat

Virtual System Capacity Summary:
Physical memory used: 26% (7180 MB out of 26862 MB) - below watermark
Kernel memory used: 4% (1247 MB out of 26862 MB) - below watermark
Virtual memory used: 22% (6879 MB out of 30970 MB) - below watermark
Used: 5707 MB by FW, 1152 MB by zeco
Concurrent Connections: 69976 (Unlimited)
Aggressive Aging is enabled, not active

Kernel memory (kmem) statistics:
Total memory bytes used: 2951060456 peak: 4987824800
Allocations: 0 alloc, 0 failed alloc
0 free, 0 failed free

Cookies:
1266493961 total, 0 alloc, 0 free,
936468 dup, 1846573516 get, 119656808 put,
4077052114 len, 1949625316 cached len, 0 chain alloc,
0 chain free

Connections:
2392359448 total, 1072002975 TCP, 647604162 UDP, 672238786 ICMP,
513525 other, 651 anticipated, 0 recovered, 69981 concurrent,
145491 peak concurrent

Fragments:
50478 fragments, 24473 packets, 1 expired, 0 short,
0 large, 5 duplicates, 0 failures

NAT:
84890/0 forw, 64538/0 bckw, 0 tcpudp,
149428 icmp, 38427-78355 alloc

-----------------------------------------------

If I look for all connections to the Master, who is contacted by lots of agents

[Expert@vistradpsg01-ch01-01:0]# fw ctl conntab | grep "Jenkins Master" | wc -l
924

And one specific agent has only 5 sessions... 

[Expert@vistradpsg01-ch01-01:0]# fw ctl conntab | grep 10.107.43.202 | wc -l
5

Do you or anyone else think there might be an issue?


Thanks in advance and BR,

Thomas

0 Kudos
the_rock
Legend
Legend

Hey Thomas,

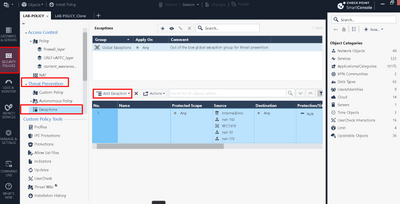
I am positive you dont have connections table limit issue, thats abundantly clear from your output, so you are fine there. I remember once with a customer, we discovered after lots of troubleshooting and from debugs there was specific IPS connection causing the issue, so maybe what you could try (though I cant say for certain this would make a difference in your case) is add an exception for affected subnets as per below screenshot:


Screenshot_1.png

0 Kudos
T_Sonnberger
Contributor

I just wanted to share an update.

The Jenkins team hast done some optimizations on the "Master VM" as well as configuring some "performance optimization" parameters on the agents. 

After these changes, the CPU Wait time on the Jenkins Master decreased from 60% - 80%  down to < 10% and since then, the agents do not loose the connections anymore.

It appears, that the disconnect happened due to an overloaded master server and the "reconnecte" failed  because the agents use an old session for the retry, which is blocked on the firewall then.

In the end, the firewall does not cause the connection loss, but only prevents the reconnect - which is due to bad network behaviour of Jenkins (imo).


Thank you all for your support!

the_rock
Legend
Legend

Awesome news, thanks for sharing! 👍

0 Kudos

Leaderboard

Epsum factorial non deposit quid pro quo hic escorol.

Upcoming Events

    Tue 23 Apr 2024 @ 11:00 AM (EDT)

    East US: What's New in R82

    Thu 25 Apr 2024 @ 11:00 AM (SGT)

    APAC: CPX 2024 Recap

    Tue 30 Apr 2024 @ 03:00 PM (CDT)

    EMEA: CPX 2024 Recap

    Thu 02 May 2024 @ 11:00 AM (SGT)

    APAC: What's new in R82

    Tue 23 Apr 2024 @ 11:00 AM (EDT)

    East US: What's New in R82

    Thu 25 Apr 2024 @ 11:00 AM (SGT)

    APAC: CPX 2024 Recap

    Tue 30 Apr 2024 @ 03:00 PM (CDT)

    EMEA: CPX 2024 Recap

    Thu 02 May 2024 @ 11:00 AM (SGT)

    APAC: What's new in R82
    CheckMates Events