- Products
- Learn
- Local User Groups
- Partners
- More
This website uses Cookies. Click Accept to agree to our website's cookie use as described in our Privacy Policy. Click Preferences to customize your cookie settings.
- Products
- Learn
- Local User Groups
- Upcoming Events
- Americas
- EMEA
- Czech Republic and Slovakia
- Denmark
- Netherlands
- Germany
- Sweden
- United Kingdom and Ireland
- France
- Spain
- Norway
- Ukraine
- Baltics and Finland
- Greece
- Portugal
- Austria
- Kazakhstan and CIS
- Switzerland
- Romania
- Turkey
- Belarus
- Belgium & Luxembourg
- Russia
- Poland
- Georgia
- DACH - Germany, Austria and Switzerland
- Iberia
- Africa
- Adriatics Region
- Eastern Africa
- Israel
- Nordics
- Middle East and Africa
- Balkans
- Italy
- Bulgaria
- Cyprus
- APAC
- Partners
- More
- ABOUT CHECKMATES & FAQ
- Sign In
- Leaderboard
- Events
The State of Ransomware Q1 2026
Key Trends and Their Impact
Good, Better, Best:
Prioritizing Defenses Against Credential Abuse
AI Security Masters E7:
How CPR Broke ChatGPT's Isolation and What It Means for You
Blueprint Architecture for Securing
The AI Factory & AI Data Center
Call For Papers
Your Expertise. Our Stage
CheckMates Go:
CheckMates Fest
Turn on suggestions
Auto-suggest helps you quickly narrow down your search results by suggesting possible matches as you type.
Showing results for
- CheckMates
- :
- Products
- :
- Hybrid Mesh
- :
- Firewall and Security Management
- :
- Re: Strange ( periodic ) packet loss
Options
- Subscribe to RSS Feed
- Mark Topic as New
- Mark Topic as Read
- Float this Topic for Current User
- Bookmark
- Subscribe
- Mute
- Printer Friendly Page
Turn on suggestions
Auto-suggest helps you quickly narrow down your search results by suggesting possible matches as you type.
Showing results for
Are you a member of CheckMates?
×
Sign in with your Check Point UserCenter/PartnerMap account to access more great content and get a chance to win some Apple AirPods! If you don't have an account, create one now for free!
- Mark as New
- Bookmark
- Subscribe
- Mute
- Subscribe to RSS Feed
- Permalink
- Report Inappropriate Content
Strange ( periodic ) packet loss
Good afternoon.
We have a cluster (HA) of 15600 with R80.40 actual JHF. Faced with a problem - some time after restarting the active node, starts losing packets. I.e. everything is working fine, then suddenly a couple (usually 2) packets are lost. Rebooting the active device - the problem goes away for a while, but then comes back.
Our scheme - the CP cluster by 10 Gb SFP+ port on interface card is connected to the core switch, from which VLANs are going through a large multi-storey building. The gateway for all is the CP.
Looked for errors on the CP port toward the switch - no errors. Decided to find a new little switch and try to connect a test segment of users through it for test (now serching for witch). fw ctl zdebug drop show nothing.... While we are looking for a switch, maybe you can offer some ideas on debugging, please.
On screen we pings gateway for this net (on on CP's VLAN port) and google DNS server.
22 Replies
- Mark as New
- Bookmark
- Subscribe
- Mute
- Subscribe to RSS Feed
- Permalink
- Report Inappropriate Content
Hi @EVSolovyev
I would check the following:
1) Is your internet connection ok before the firewall?
2) Check if you have errors on the interfaces (RX-OVR, RX-ERR, RX-DRP)
# netstat -in
3) Is multi queueing enabled for the 10G interface?
# mq_mng --show -v
4) You can see a high utilisation of the software interrupts (si) in the SecureXL instances.
# fw ctl affinity -l -> Check which cores are used for SecureXL (Interfaces)
# top + 1 -> View the cores of the SecureXL instances
5) Running "show asset" command returns "Line Card Type: N/A" rather than properly identifying an installed 4 Port 10GBase-F SFP+
> show asset
6) Do you see any interface errors in the file /var/log/messages
cat /var/log/messages | grep "NETDEV"
➜ CCSM Elite, CCME, CCTE ➜ www.checkpoint.tips
- Mark as New
- Bookmark
- Subscribe
- Mute
- Subscribe to RSS Feed
- Permalink
- Report Inappropriate Content
Hello, @HeikoAnkenbrand
Thank you for the detailed answer.
1. I think, internet connected well - at this moment I see no droped packet to internet (ping about 2k packets).
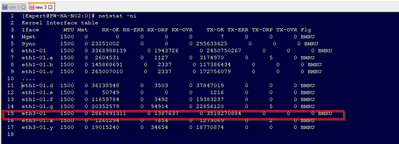
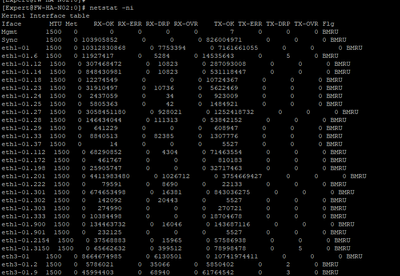
2. There is no errors, but I see drops:
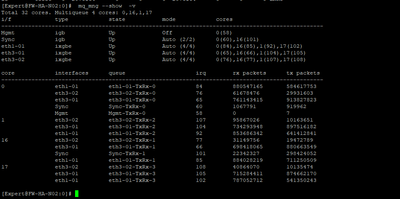
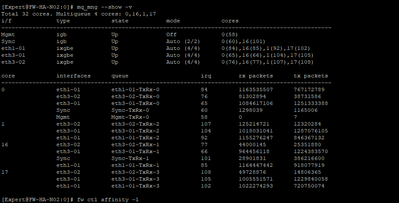
3. Multi queueing enabled on 4 cores:
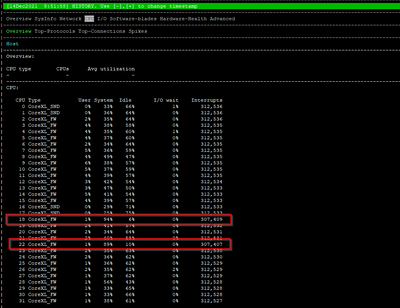
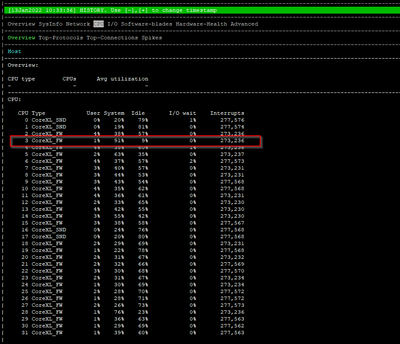
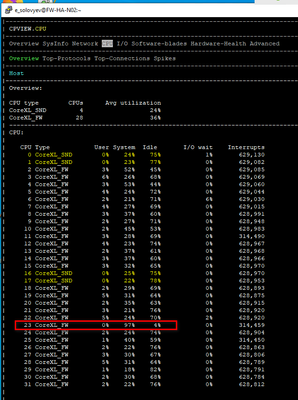
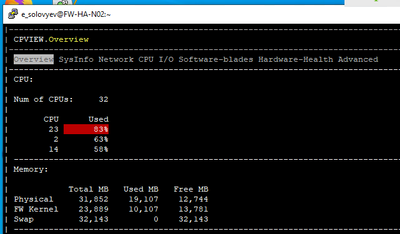
4. In some times I see full utilization on some cores. But this is a rare occurrence and I have not yet been able to catch the process that does this. I think that fw_worker.
5. No, all is good:
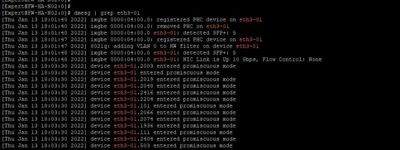
6. No, there is nothing....:
But....:
What it can be?
- Mark as New
- Bookmark
- Subscribe
- Mute
- Subscribe to RSS Feed
- Permalink
- Report Inappropriate Content
It can be seen that the RX-DRP are high. If the errors continue to increase means that the SNDs can no longer handle the traffic.
I would give the system more SND cores in the first step change from 4 to 6 cores. Thus, more cores should also be used for multi queueing. Thus, more cores should also be used for multi queueing.
➜ CCSM Elite, CCME, CCTE ➜ www.checkpoint.tips
- Mark as New
- Bookmark
- Subscribe
- Mute
- Subscribe to RSS Feed
- Permalink
- Report Inappropriate Content
I agree with that, we increased our SND allocation to 6 cores; and we are running 15600s as well.
- Mark as New
- Bookmark
- Subscribe
- Mute
- Subscribe to RSS Feed
- Permalink
- Report Inappropriate Content
I'm sorry, but I don't understand your advice.... My SND configuration:
Here we can see:
Best Practice - We recommend to allocate an additional CPU core to the CoreXL SND only if all these conditions are met:
There are at least 8 processing CPU cores.
In the output of the top command, the idle values for the CPU cores that run the CoreXL SND instances are in the 0%-5% range.
In the output of the top command, the sum of the idle values for the CPU cores that run the CoreXL Firewall instances is significantly higher than 100%.
If at least one of the above conditions is not met, the default CoreXL configuration is sufficient.
Whan I see cpview for CPU (screens are upper), I see, that about 100% utilization CPUs are mapped for fw_workers. I see never 100% utilization of SND cores.
And I'm sorry, but I can't understand, how to add 2 cores from fw to SND.... Am I need to decrease number of fw_workers in cpconfog only and free cores are automatically were added to SND after rebooting? Or to increase the number of SND cores I need to go some other way, which I have not yet been able to find?
- Mark as New
- Bookmark
- Subscribe
- Mute
- Subscribe to RSS Feed
- Permalink
- Report Inappropriate Content
Are these VSX appliances using virtual switches?
- Mark as New
- Bookmark
- Subscribe
- Mute
- Subscribe to RSS Feed
- Permalink
- Report Inappropriate Content
VSX is disabled and not used.
- Mark as New
- Bookmark
- Subscribe
- Mute
- Subscribe to RSS Feed
- Permalink
- Report Inappropriate Content
ok thanks, I have a similar issue with VSX and VSWs, but as your not running VSX no point in bring this to the table.
Can you confirm what jump your running? I would ensure your running at least JHFA125 (GA is JHFA139)
- Mark as New
- Bookmark
- Subscribe
- Mute
- Subscribe to RSS Feed
- Permalink
- Report Inappropriate Content
- Mark as New
- Bookmark
- Subscribe
- Mute
- Subscribe to RSS Feed
- Permalink
- Report Inappropriate Content
looks ok to me, I know we had issues with DNS packets and soon as we updated to that Jumbo issue was resolved.
can you also confirm no debugging is running 'fw ctl debug 0'. So we ensure its not a resource issues because of that.
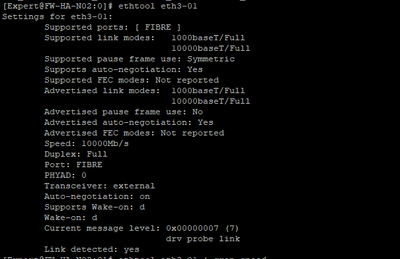
Additionally silly checks like duplex settings
run this:
ifconfig -a | grep encap | awk '{print $1}' | grep -v lo | grep -v bond | grep -v ":" | grep -v ^lo | xargs -I % sh -c 'ethtool %; ethtool -i %' | grep '^driver\|Speed\|Duplex\|Setting' | sed "s/^/ /g" | tr -d "\t" | tr -d "\n" | sed "s/Settings for/\nSettings for/g" | awk '{print $5 " "$7 "\t " $9 "\t" $3}' | grep -v "Unknown" | grep -v "\."
and of course what Heiko has suggested to check.
- Mark as New
- Bookmark
- Subscribe
- Mute
- Subscribe to RSS Feed
- Permalink
- Report Inappropriate Content
Duplex - first thing, that was checked. ) I see no CPU utilization.
- Mark as New
- Bookmark
- Subscribe
- Mute
- Subscribe to RSS Feed
- Permalink
- Report Inappropriate Content
You mention it happens on the active device. Is it always the same device displaying this behavior, or does it happen on whatever machine becomes active after reboot?
In addition to all what was explained here, you might want to do a failover and run the hardware diagnostics tool during a maintenance window. It could indicate if it's an issue with your NIC's.
- Mark as New
- Bookmark
- Subscribe
- Mute
- Subscribe to RSS Feed
- Permalink
- Report Inappropriate Content
It happen on whatever machine becomes active after reboot, but not immediately - after some time. May be some hours, or days. In CP cluster we have 2 devices, but core switch is a single device with multiple line cards.
- Mark as New
- Bookmark
- Subscribe
- Mute
- Subscribe to RSS Feed
- Permalink
- Report Inappropriate Content
I have similar issues where after a reboot I get packet loss after about 4 weeks, but this is on a VSX system and R&D have confirmed a bug.
You may want to log a TAC case, just in case its a bug; additionally perhaps installed the latest GA Jumbo as TAC will likely ask for this to be done.
- Mark as New
- Bookmark
- Subscribe
- Mute
- Subscribe to RSS Feed
- Permalink
- Report Inappropriate Content
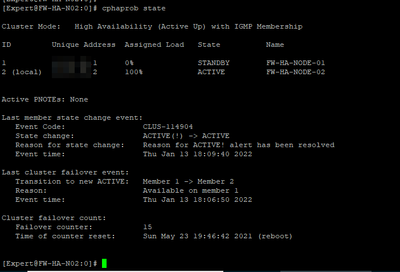
First off you need to make sure your cluster is stable, as losing 2 ping packets in a row will generally happen when there is a non-graceful failover between members. What is the failover count shown by cphaprob state from expert mode?
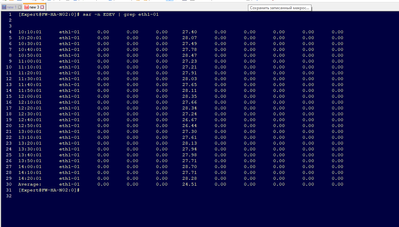
RX-DRPs could be the source of the drops, but those could also be non-IPv4 packets hitting the interface and getting dropped. Please provide updated output of netstat -ni along with ethtool -S eth3 so we can distinguish between ring buffer drops and unknown protocol drops. Based on the fact you are getting them on all interfaces they are probably unknown protocol drops. If they are actually ring buffer drops you can look at the history of when that counter is getting incremented with sar -n EDEV to see if it is slowly incrementing, or coming in clumps when you are experiencing the loss.
The high CPU utilization on some workers could be caused by elephant flows, and any "mice" trapped on that worker core with an elephant flow will be degraded and possibly lose packets. Any elephant flows in the last 24 hours reported by running fw ctl multik print_heavy_conn?
New Book: "Max Power 2026" Coming Soon
Check Point Firewall Performance Optimization
Check Point Firewall Performance Optimization
- Mark as New
- Bookmark
- Subscribe
- Mute
- Subscribe to RSS Feed
- Permalink
- Report Inappropriate Content
Hello.
Thank you for answer.
Yes, cluster is stable. "What is the failover count shown by cphaprob state from expert mode?" Info is here. 15 failovers is due to collegues rebooting the active device when losses start to occur. Reboot solves the problem for a few days.
Yes, sometime we have a big traffic connections:
- Mark as New
- Bookmark
- Subscribe
- Mute
- Subscribe to RSS Feed
- Permalink
- Report Inappropriate Content
The constant rate of RX-DRP reported by sar would seem to indicate the presence of non-IPv4 protocols and probably not packet loss due to SNDs being overloaded, please provide the output of ethtool -S eth1-01 to be sure.
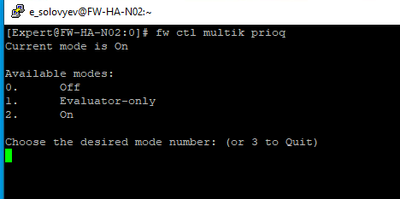
Looks like you have quite a few elephant flows squashing "mice" connections when they get trapped on a worker core with an elephant flow which could be the source of your packet loss. Make sure that priority queueing is enabled for when workers get fully loaded by running this command: fw ctl multik prioq
Beyond that you'll need to upgrade to R81 or later to take advantage of the pipeline paths that can spread the processing of elephant flows across multiple worker cores.
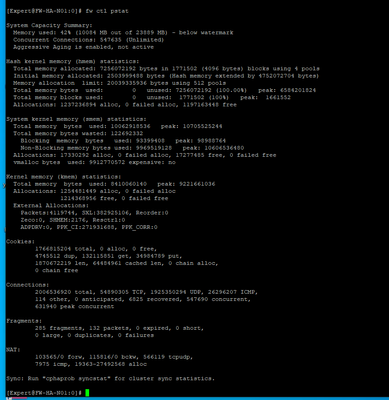
Also please provide the output of fw ctl pstat just in case it is a resource limitation on the firewall.
New Book: "Max Power 2026" Coming Soon
Check Point Firewall Performance Optimization
Check Point Firewall Performance Optimization
- Mark as New
- Bookmark
- Subscribe
- Mute
- Subscribe to RSS Feed
- Permalink
- Report Inappropriate Content
Hello.
Sorry for the delay in replying - my colleagues rebooted the devices and the problem went away.
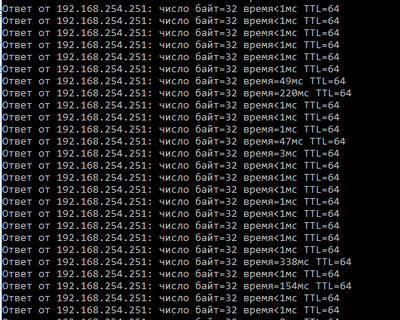
There are no losses now, but there are delays. Pings a gateway (CP) for this machine:
On SND cores I am not able to catch high load. But I can see the ceiling on the workers.
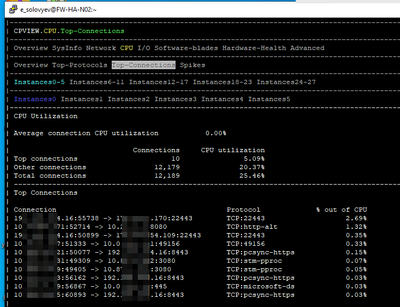
But I see no elephant streems in cpview:
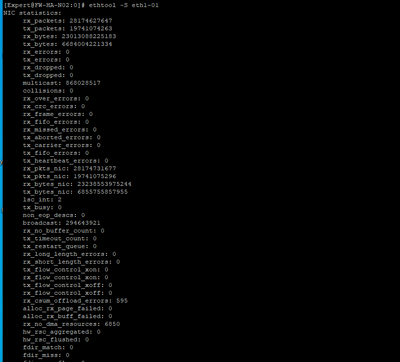
ethtool -S eth1-01:
fw ctl multik prioq:
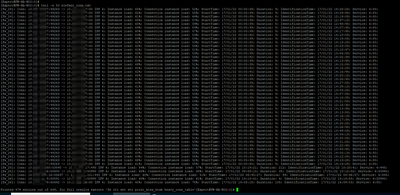
fw ctl pstat:
I have read the RN for the R81 but found no mention of this. Can you please tell me where you got this information?
- Mark as New
- Bookmark
- Subscribe
- Mute
- Subscribe to RSS Feed
- Permalink
- Report Inappropriate Content
As a symptom this sounds exactly like my issue, after a reboot packet loss goes away for about 5 to 6 weeks.
Can you get CP TAC to check you are not experience this bug: PRJ-25443
- Mark as New
- Bookmark
- Subscribe
- Mute
- Subscribe to RSS Feed
- Permalink
- Report Inappropriate Content
Yeah you'll need to run these commands again when the cluster is having issues as I don't see a smoking gun in those outputs. The only slightly unusual thing are the rx_no_dma_resources drops on your interface but there probably aren't enough of them to be significant.
The pipeline paths which are enabled by default in R81 aren't really documented, I learned about them in a call with R&D. 🙂 However if you are not having elephant flow issues I don't think the pipeline paths will help much, but we'll need to identify what the actual issue is first before making that determination.
Generally if firewall performance degrades over time it is some kind of occasional failure to free a resource that eventually starts to run short. The fw ctl pstat output would probably be most relevant if that is the case.
New Book: "Max Power 2026" Coming Soon
Check Point Firewall Performance Optimization
Check Point Firewall Performance Optimization
- Mark as New
- Bookmark
- Subscribe
- Mute
- Subscribe to RSS Feed
- Permalink
- Report Inappropriate Content
Hi @EVSolovyev,
Do you have or had a SR opened with Check Point support on this issue by any chance? If so, can you reply to me with the SR#?
Thanks,
Dolev
- Mark as New
- Bookmark
- Subscribe
- Mute
- Subscribe to RSS Feed
- Permalink
- Report Inappropriate Content
Good afternoon.
No, we have not opened an SR at this time. The problem is that our support ran out, and we did not renew it in time. Now the process of buying it is underway. We are a state company and such processes are very slow. If we had tech support, I would have opened SR right away.
Leaderboard
Epsum factorial non deposit quid pro quo hic escorol.
| User | Count |
|---|---|
| 33 | |
| 10 | |
| 10 | |
| 9 | |
| 8 | |
| 7 | |
| 7 | |
| 6 | |
| 6 | |
| 6 |
Upcoming Events
Tue 12 May 2026 @ 10:00 AM (CEST)
The Cloud Architects Series: Check Point Cloud Firewall delivered as a serviceWed 13 May 2026 @ 11:00 AM (EDT)
TechTalk: The State of Ransomware Q1 2026: Key Trends and Their ImpactThu 14 May 2026 @ 07:00 PM (EEST)
Under the Hood: Presentando Check Point Cloud Firewall como ServicioTue 12 May 2026 @ 10:00 AM (CEST)
The Cloud Architects Series: Check Point Cloud Firewall delivered as a serviceAbout CheckMates
Learn Check Point
Advanced Learning
YOU DESERVE THE BEST SECURITY
©1994-2026 Check Point Software Technologies Ltd. All rights reserved.
Copyright
Privacy Policy
About Us
UserCenter


