- Products
Network & SASE IoT Protect Maestro Management OpenTelemetry/Skyline Remote Access VPN SASE SD-WAN Security Gateways SmartMove Smart-1 Cloud SMB Gateways (Spark) Threat PreventionCloud Cloud Network Security CloudMates General CloudGuard - WAF Talking Cloud Podcast Weekly ReportsSecurity Operations Events External Risk Management Incident Response Infinity AI Infinity Portal NDR Playblocks SOC XDR/XPR Threat Exposure Management
- Learn
- Local User Groups
- Partners
- More
This website uses Cookies. Click Accept to agree to our website's cookie use as described in our Privacy Policy. Click Preferences to customize your cookie settings.
- Products
- AI Security
- Developers & More
- Check Point Trivia
- CheckMates Toolbox
- General Topics
- Products Announcements
- Threat Prevention Blog
- Upcoming Events
- Americas
- EMEA
- Czech Republic and Slovakia
- Denmark
- Netherlands
- Germany
- Sweden
- United Kingdom and Ireland
- France
- Spain
- Norway
- Ukraine
- Baltics and Finland
- Greece
- Portugal
- Austria
- Kazakhstan and CIS
- Switzerland
- Romania
- Turkey
- Belarus
- Belgium & Luxembourg
- Russia
- Poland
- Georgia
- DACH - Germany, Austria and Switzerland
- Iberia
- Africa
- Adriatics Region
- Eastern Africa
- Israel
- Nordics
- Middle East and Africa
- Balkans
- Italy
- Bulgaria
- Cyprus
- APAC
CheckMates Fest 2026
Join the Celebration!
AI Security Masters
E1: How AI is Reshaping Our World
MVP 2026: Submissions
Are Now Open!
What's New in R82.10?
Watch NowOverlap in Security Validation
Help us to understand your needs better
CheckMates Go:
Maestro Madness
Turn on suggestions
Auto-suggest helps you quickly narrow down your search results by suggesting possible matches as you type.
Showing results for
- CheckMates
- :
- Products
- :
- Network & SASE
- :
- Security Gateways
- :
- High latency after Check Point firewall from R77.3...
Options
- Subscribe to RSS Feed
- Mark Topic as New
- Mark Topic as Read
- Float this Topic for Current User
- Bookmark
- Subscribe
- Mute
- Printer Friendly Page
Turn on suggestions
Auto-suggest helps you quickly narrow down your search results by suggesting possible matches as you type.
Showing results for
Are you a member of CheckMates?
×
Sign in with your Check Point UserCenter/PartnerMap account to access more great content and get a chance to win some Apple AirPods! If you don't have an account, create one now for free!
- Mark as New
- Bookmark
- Subscribe
- Mute
- Subscribe to RSS Feed
- Permalink
- Report Inappropriate Content
High latency after Check Point firewall from R77.30 to R80.10
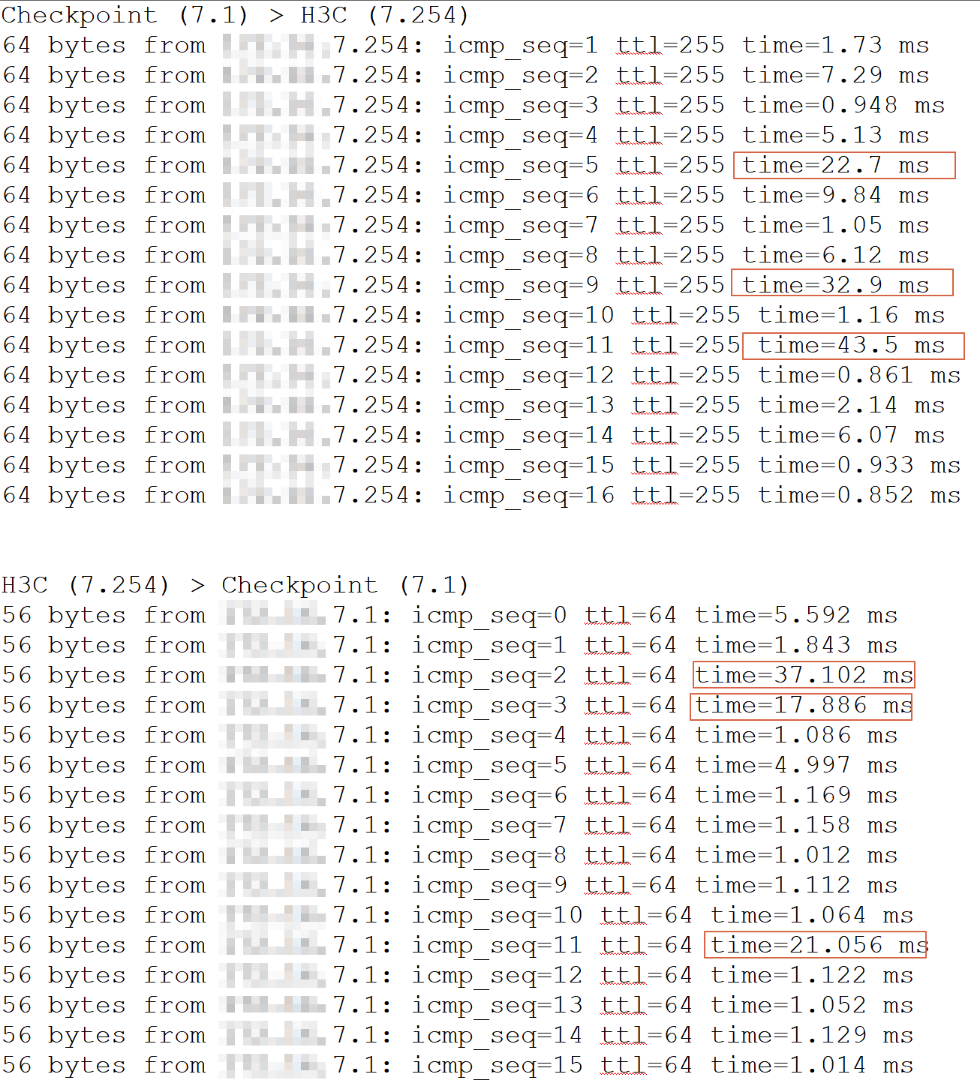
As before we are running on CP R77.30 hardware model is 13500 with cluster appliance with smooth and normal performance. But after upgrade to R80.10 all network performance to slow down, for example, we have PRTG monitor (network via checkpoint) have monitor our website performance, on R77.30 the loading time around 5x-1xx ms, after R80.10 drop to 5xx - 4xxxx ms. The second case is we have ping test under our core switch, the interface plug into Checkpoint firewall directly. The R77.30 ping time is below 5ms, after R80.10 over 1x - 5x ms.
I know that's very simple evidence and test result. But how to be next step? Hope I can get more advice, Tks guys
- Tags:
- high latency
47 Replies
- Mark as New
- Bookmark
- Subscribe
- Mute
- Subscribe to RSS Feed
- Permalink
- Report Inappropriate Content
Can you verify that the cluster and the network interfaces are in a good state using cli?
the ICMP echo from adjacent switch should not be taking that long.
Are the cluster members connected to the HSRP pair of switches?
Do you have a vMAC enabled on the cluster?
- Mark as New
- Bookmark
- Subscribe
- Mute
- Subscribe to RSS Feed
- Permalink
- Report Inappropriate Content
Seems no packet lost when I check in cli.
Our core switch is H3C, i remember it's using VRRP.
for vMAC, are you said the Checkpoint cluster enable vMAC?
Tks Vladimir
- Mark as New
- Bookmark
- Subscribe
- Mute
- Subscribe to RSS Feed
- Permalink
- Report Inappropriate Content
Does the speed and duplex look good on all interfaces?
As to vMAC, you have option of enabling it:
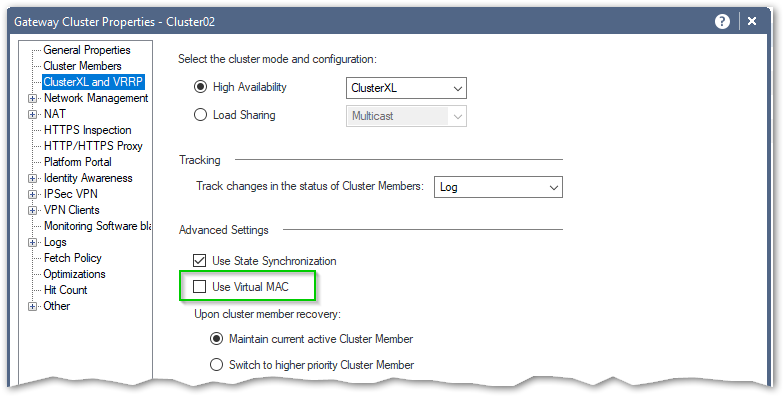
Depending on topology of your network, use of STP, etc., it may make sense to enable it.
If you can, do the "tcpdump -tttt -ne host <IP of the cluster>" on your switch and check if the replies are coming from the expected interface of the active cluster member or vMAC.
- Mark as New
- Bookmark
- Subscribe
- Mute
- Subscribe to RSS Feed
- Permalink
- Report Inappropriate Content
As checked the speed and duplex look good.
for vMAC, we haven't enable on ClusterXL. But it will make network down when enable this function? Thanks
- Mark as New
- Bookmark
- Subscribe
- Mute
- Subscribe to RSS Feed
- Permalink
- Report Inappropriate Content
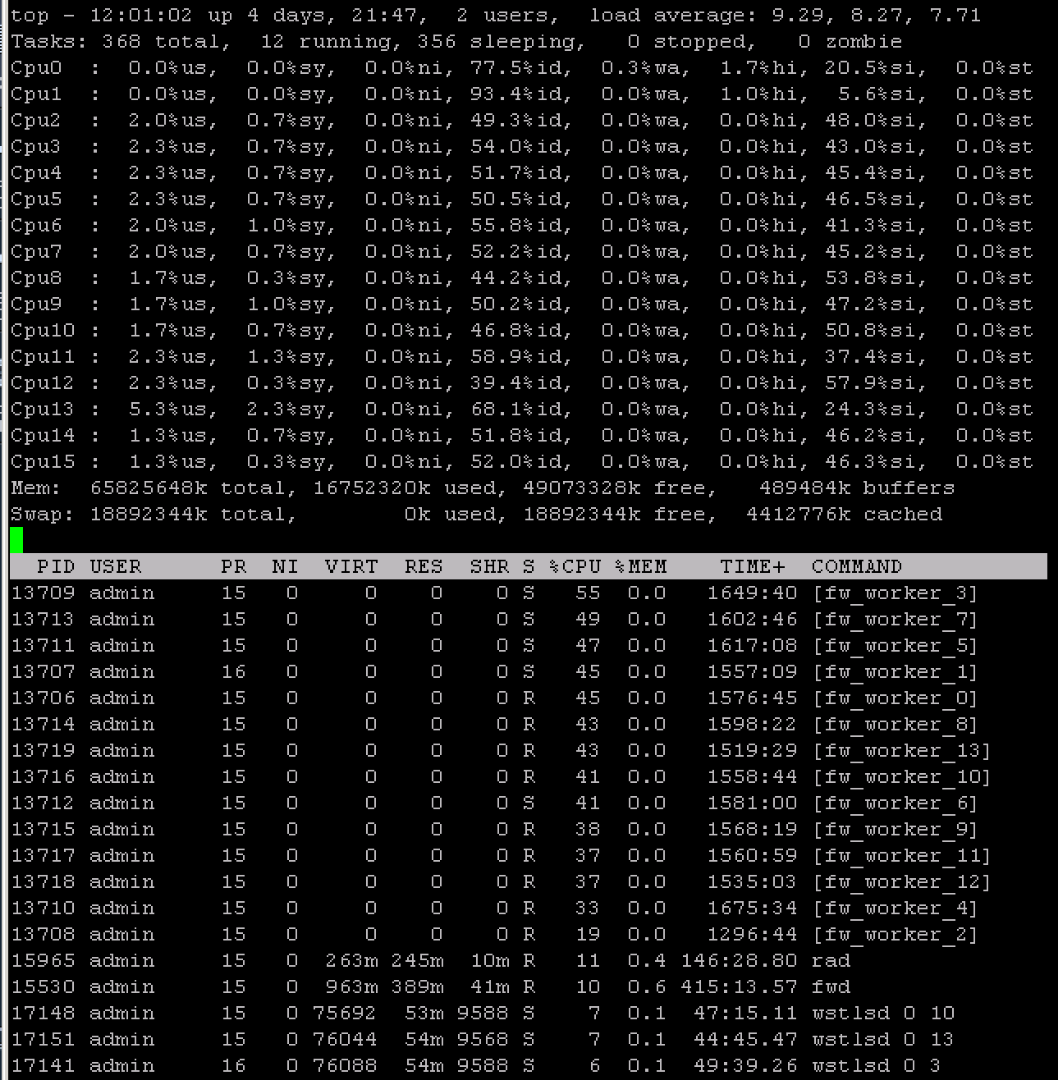
Almost sounds like firewall under load. Have you checked CPU/ram/throughput? How do you run your ping from FW to switch or vice versa?
- Mark as New
- Bookmark
- Subscribe
- Mute
- Subscribe to RSS Feed
- Permalink
- Report Inappropriate Content
I can give some ping test result as below
CPU loading
Ping Result
- Mark as New
- Bookmark
- Subscribe
- Mute
- Subscribe to RSS Feed
- Permalink
- Report Inappropriate Content
What about other commands that Tim asked for? Acceleration, interface stats, CoreXL?
- Mark as New
- Bookmark
- Subscribe
- Mute
- Subscribe to RSS Feed
- Permalink
- Report Inappropriate Content
Also what interface speed is set on the interface you run ping on and what is the throughput there?
- Mark as New
- Bookmark
- Subscribe
- Mute
- Subscribe to RSS Feed
- Permalink
- Report Inappropriate Content
All interface speed is 1G
- Mark as New
- Bookmark
- Subscribe
- Mute
- Subscribe to RSS Feed
- Permalink
- Report Inappropriate Content
one more test. on Checkpoint firewall active node ping the local interface, seems lager ping time suddenly.
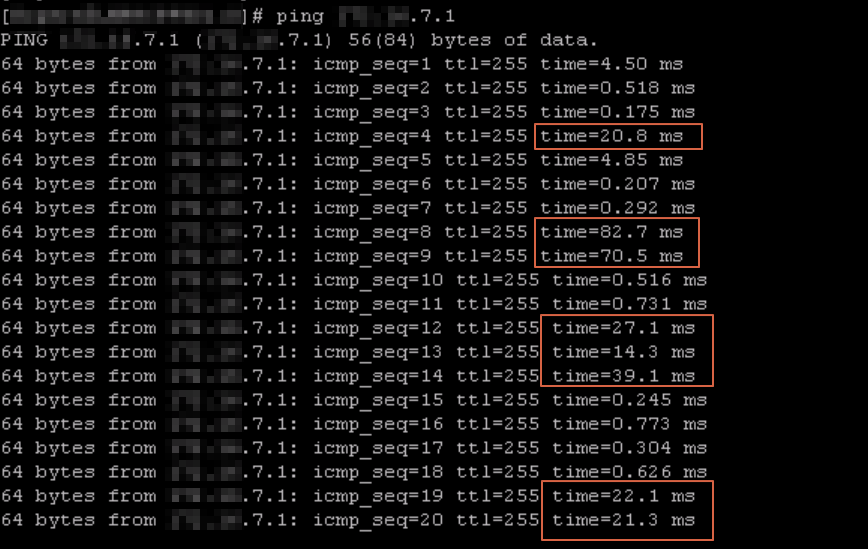
- Mark as New
- Bookmark
- Subscribe
- Mute
- Subscribe to RSS Feed
- Permalink
- Report Inappropriate Content
Ben,
Please confirm that xxx.xxx.7.1 is, in fact, an active cluster member's IP address and not the vIP of the cluster on this network.
Additionally, please run a "show interface eth#" on the interface connected to the H3C switch(es).
I would like to see the mtu value on it on both cluster members.
Can you also verify the cluster's status with "cphaprob stat" and "cphaprob -a if"
I am interested to know:
1. if you are using multicast or broadcast for CCP
2. if your cluster members are connected to the same switch or is it a pair of switches in VRRP
3. if you have STP configured on the switch ports the cluster members are connected to
4. if you have inherited any "domain objects" from R77.30 that are no longer resolving properly
5. if you recently configured any vpn tunnel interfaces on cluster members
- Mark as New
- Bookmark
- Subscribe
- Mute
- Subscribe to RSS Feed
- Permalink
- Report Inappropriate Content
Tough to say but it sounds like you may have cluster-related issues if latency has spiked that much after the upgrade. Easy way to determine that is:
1) Power off the standby cluster member. Does the latency situation improve? If it does, your problem is cluster-related and you need to have a look at logs with the "type:Control" log filter to see what is going on. If the cluster is not stable and constantly failing over you may need to set broadcast mode for CCP.
2) Next step is to ensure the network is running cleanly. Are all firewall interfaces running at 1Gbps or higher speed? Any Fast Ethernet (100Mbps) interfaces need to be checked for a duplex mismatch.
3) Was the firewall upgrade in-place (i.e. upgraded the same hardware directly from R77.30 to R80.10 with CPUSE) or forklift (new firewall hardware scratch-loaded and dropped into place). If it is the latter you may have lost some local adjustments in fwkern.conf or /etc/rc.local, or may be running with the default CoreXL split of 2/14 which almost always needs to be adjusted on a 13500 in the real world. You can check the CoreXL split with fw ctl affinity -l -r.
Failing all of those, please post the output from the following "Super Seven" commands run in expert mode on the primary/active cluster member during an observed period of high latency and I can advise further:
fwaccel stat
fwaccel stats -s
grep -c ^processor /proc/cpuinfo
fw ctl affinity -l -r
netstat -ni
fw ctl multik stat
cpstat os -f multi_cpu -o 1
--
Second Edition of my "Max Power" Firewall Book
Now Available at http://www.maxpowerfirewalls.com
Gaia 4.18 (R82) Immersion Tips, Tricks, & Best Practices Video Course
Now Available at https://shadowpeak.com/gaia4-18-immersion-course
Now Available at https://shadowpeak.com/gaia4-18-immersion-course
- Mark as New
- Bookmark
- Subscribe
- Mute
- Subscribe to RSS Feed
- Permalink
- Report Inappropriate Content
Hi Tim
Here is infromation follow your "Super Serven" command, Tks for your help, and know new terms of checkpoint "Super Serven".
[Expert@LMPRCPFW01:0]# fwaccel stat
Accelerator Status : on
Accept Templates : disabled by Firewall
Layer PDC_CP_Firewall Security disables template offloads from rule #116
Throughput acceleration still enabled.
Drop Templates : disabled
NAT Templates : disabled by user
NMR Templates : enabled
NMT Templates : enabled
Accelerator Features : Accounting, NAT, Cryptography, Routing,
HasClock, Templates, Synchronous, IdleDetection,
Sequencing, TcpStateDetect, AutoExpire,
DelayedNotif, TcpStateDetectV2, CPLS, McastRouting,
WireMode, DropTemplates, NatTemplates,
Streaming, MultiFW, AntiSpoofing, Nac,
ViolationStats, AsychronicNotif, ERDOS,
McastRoutingV2, NMR, NMT, NAT64, GTPAcceleration,
SCTPAcceleration
Cryptography Features : Tunnel, UDPEncapsulation, MD5, SHA1, NULL,
3DES, DES, CAST, CAST-40, AES-128, AES-256,
ESP, LinkSelection, DynamicVPN, NatTraversal,
EncRouting, AES-XCBC, SHA256
[Expert@LMPRCPFW01:0]# fwaccel stats -s
Accelerated conns/Total conns : 0/94 (0%)
Accelerated pkts/Total pkts : 0/6854226 (0%)
F2Fed pkts/Total pkts : 6854226/6854226 (100%)
PXL pkts/Total pkts : 0/6854226 (0%)
QXL pkts/Total pkts : 0/6854226 (0%)
[Expert@LMPRCPFW01:0]# grep -c ^processor /proc/cpuinfo
16
[Expert@LMPRCPFW01:0]# fw ctl affinity -l -r
CPU 0: eth2-01 eth2-02 eth1-07 eth1-08 eth2-04 Mgmt Sync
CPU 1: eth1-01 eth1-02 eth1-03 eth1-04 eth1-05 eth1-06 eth2-03
CPU 2: fw_13
fwd pepd lpd usrchkd in.msd mpdaemon pdpd vpnd fwucd rad in.emaild.mta in.acapd cpd cprid
CPU 3: fw_12
fwd pepd lpd usrchkd in.msd mpdaemon pdpd vpnd fwucd rad in.emaild.mta in.acapd cpd cprid
CPU 4: fw_11
fwd pepd lpd usrchkd in.msd mpdaemon pdpd vpnd fwucd rad in.emaild.mta in.acapd cpd cprid
CPU 5: fw_10
fwd pepd lpd usrchkd in.msd mpdaemon pdpd vpnd fwucd rad in.emaild.mta in.acapd cpd cprid
CPU 6: fw_9
fwd pepd lpd usrchkd in.msd mpdaemon pdpd vpnd fwucd rad in.emaild.mta in.acapd cpd cprid
CPU 7: fw_8
fwd pepd lpd usrchkd in.msd mpdaemon pdpd vpnd fwucd rad in.emaild.mta in.acapd cpd cprid
CPU 8: fw_7
fwd pepd lpd usrchkd in.msd mpdaemon pdpd vpnd fwucd rad in.emaild.mta in.acapd cpd cprid
CPU 9: fw_6
fwd pepd lpd usrchkd in.msd mpdaemon pdpd vpnd fwucd rad in.emaild.mta in.acapd cpd cprid
CPU 10: fw_5
fwd pepd lpd usrchkd in.msd mpdaemon pdpd vpnd fwucd rad in.emaild.mta in.acapd cpd cprid
CPU 11: fw_4
fwd pepd lpd usrchkd in.msd mpdaemon pdpd vpnd fwucd rad in.emaild.mta in.acapd cpd cprid
CPU 12: fw_3
fwd pepd lpd usrchkd in.msd mpdaemon pdpd vpnd fwucd rad in.emaild.mta in.acapd cpd cprid
CPU 13: fw_2
fwd pepd lpd usrchkd in.msd mpdaemon pdpd vpnd fwucd rad in.emaild.mta in.acapd cpd cprid
CPU 14: fw_1
fwd pepd lpd usrchkd in.msd mpdaemon pdpd vpnd fwucd rad in.emaild.mta in.acapd cpd cprid
CPU 15: fw_0
fwd pepd lpd usrchkd in.msd mpdaemon pdpd vpnd fwucd rad in.emaild.mta in.acapd cpd cprid
All:
[Expert@LMPRCPFW01:0]# netstat -ni
Kernel Interface table
Iface MTU Met RX-OK RX-ERR RX-DRP RX-OVR TX-OK TX-ERR TX-DRP TX-OVR Flg
Mgmt 1500 0 13702966 0 0 0 15962552 0 0 0 BMRU
Sync 1500 0 333650207 0 0 0 121769745 0 0 0 BMRU
bond2 1500 0 1441565252 1 0 0 1627548069 0 0 0 BMmRU
bond2.10 1500 0 238388484 0 0 0 147686142 0 0 0 BMmRU
bond2.163 1500 0 818903388 0 0 0 341775356 0 0 0 BMmRU
bond2.700 1500 0 384199869 0 0 0 214359826 0 0 0 BMmRU
bond3 1500 0 12815465 0 0 0 23478665 0 0 0 BMmRU
bond3.801 1500 0 4692593 0 0 0 4421277 0 0 0 BMmRU
bond3.1014 1500 0 1162293 0 0 0 595678 0 0 0 BMmRU
bond3.1209 1500 0 2280454 0 0 0 668717 0 0 0 BMmRU
bond3.1688 1500 0 4643707 0 0 0 4425602 0 0 0 BMmRU
eth1-01 1500 0 81281889 0 472 472 83202416 0 0 0 BMRU
eth1-02 1500 0 199227419 0 111 111 146528821 0 0 0 BMRU
eth1-03 1500 0 390331603 0 0 0 882904179 0 0 0 BMRU
eth1-04 1500 0 66707804 0 0 0 19987560 0 0 0 BMRU
eth1-04.210 1500 0 66707804 0 0 0 8818908 0 0 0 BMRU
eth1-05 1500 0 1012244443 0 0 0 443288453 0 0 0 BMRU
eth1-06 1500 0 4077432 0 0 0 4185548 0 0 0 BMRU
eth1-07 1500 0 8568255 0 0 0 11757975 0 0 0 BMRU
eth1-08 1500 0 333934975 0 0 0 122084202 0 0 0 BMRU
eth2-01 1500 0 724739031 1 0 0 508740663 0 0 0 BMsRU
eth2-02 1500 0 716826232 0 0 0 1118807427 0 0 0 BMsRU
eth2-03 1500 0 11301424 0 0 0 11329734 0 0 0 BMsRU
eth2-04 1500 0 1514041 0 0 0 12148931 0 0 0 BMsRU
lo 16436 0 2623169 0 0 0 2623169 0 0 0 LRU
[Expert@LMPRCPFW01:0]# fw ctl multik stat
ID | Active | CPU | Connections | Peak
----------------------------------------------
0 | Yes | 15 | 6753 | 8506
1 | Yes | 14 | 3750 | 5886
2 | Yes | 13 | 1529 | 6240
3 | Yes | 12 | 3078 | 6010
4 | Yes | 11 | 5029 | 6191
5 | Yes | 10 | 4485 | 6400
6 | Yes | 9 | 4878 | 6110
7 | Yes | 8 | 4577 | 6070
8 | Yes | 7 | 4711 | 5961
9 | Yes | 6 | 3953 | 6203
10 | Yes | 5 | 4908 | 6233
11 | Yes | 4 | 3546 | 6288
12 | Yes | 3 | 4134 | 5883
13 | Yes | 2 | 3878 | 6141
[Expert@LMPRCPFW01:0]#cpstat os -f multi_cpu -o 1
Processors load
---------------------------------------------------------------------------------
|CPU#|User Time(%)|System Time(%)|Idle Time(%)|Usage(%)|Run queue|Interrupts/sec|
---------------------------------------------------------------------------------
| 1| 0| 2| 99| 1| ?| 3313|
| 2| 0| 0| 100| 0| ?| 3313|
| 3| 1| 1| 98| 2| ?| 3313|
| 4| 2| 3| 96| 4| ?| 3313|
| 5| 1| 1| 98| 2| ?| 3313|
| 6| 0| 1| 98| 2| ?| 3313|
| 7| 0| 0| 100| 0| ?| 3314|
| 8| 0| 1| 100| 0| ?| 3315|
| 9| 0| 1| 99| 1| ?| 3315|
| 10| 2| 2| 96| 4| ?| 3315|
| 11| 0| 1| 98| 2| ?| 3315|
| 12| 0| 1| 98| 2| ?| 3315|
| 13| 0| 1| 100| 0| ?| 3315|
| 14| 0| 1| 99| 1| ?| 3315|
| 15| 0| 1| 99| 1| ?| 3315|
| 16| 0| 1| 99| 1| ?| 3315|
---------------------------------------------------------------------------------
- Mark as New
- Bookmark
- Subscribe
- Mute
- Subscribe to RSS Feed
- Permalink
- Report Inappropriate Content
Acceleration is not working at all (neither fast path nor medium) so you need to dig into that
F2Fed pkts/Total pkts : 6854226/6854226 (100%)
Pls add full stats
faccel stats
- Mark as New
- Bookmark
- Subscribe
- Mute
- Subscribe to RSS Feed
- Permalink
- Report Inappropriate Content
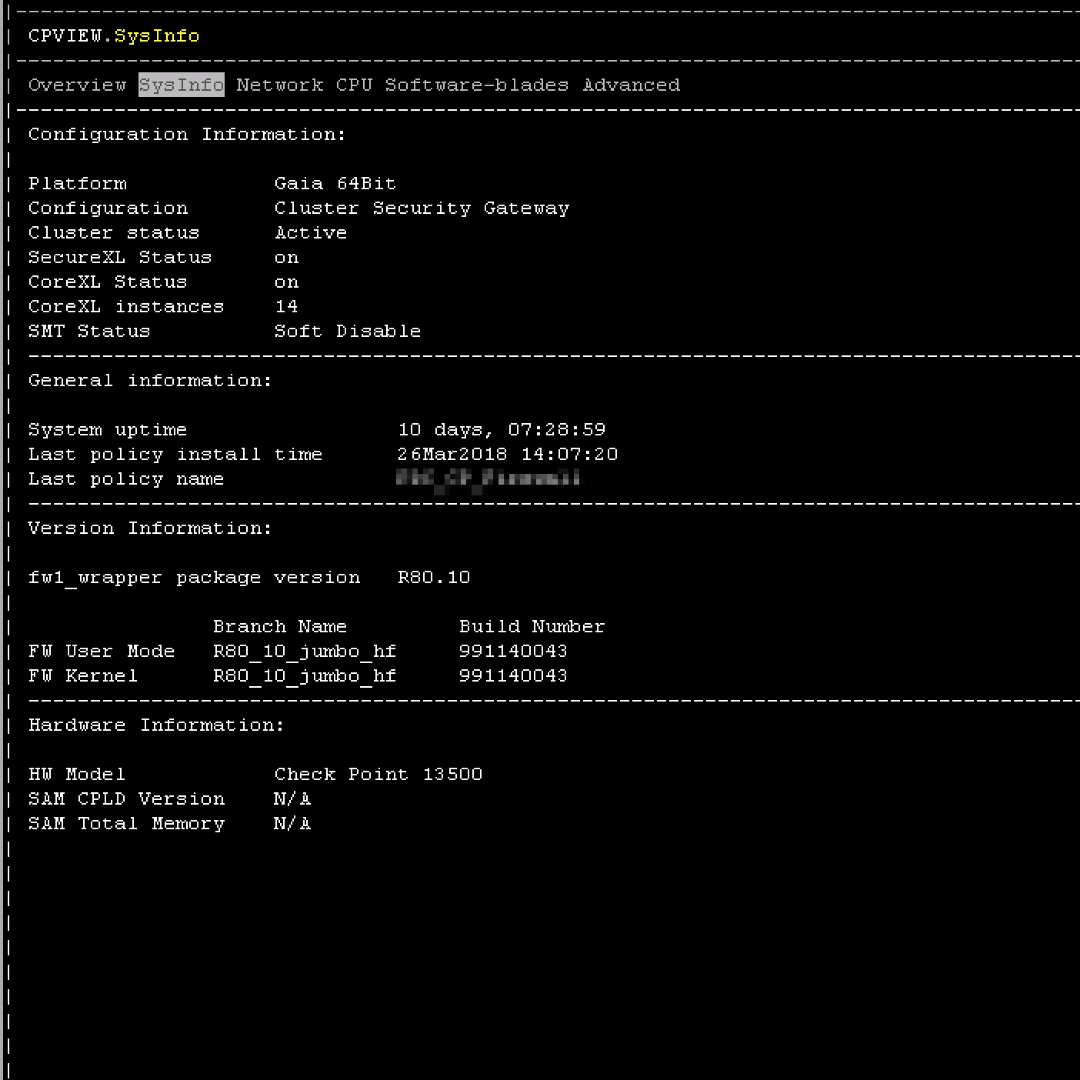
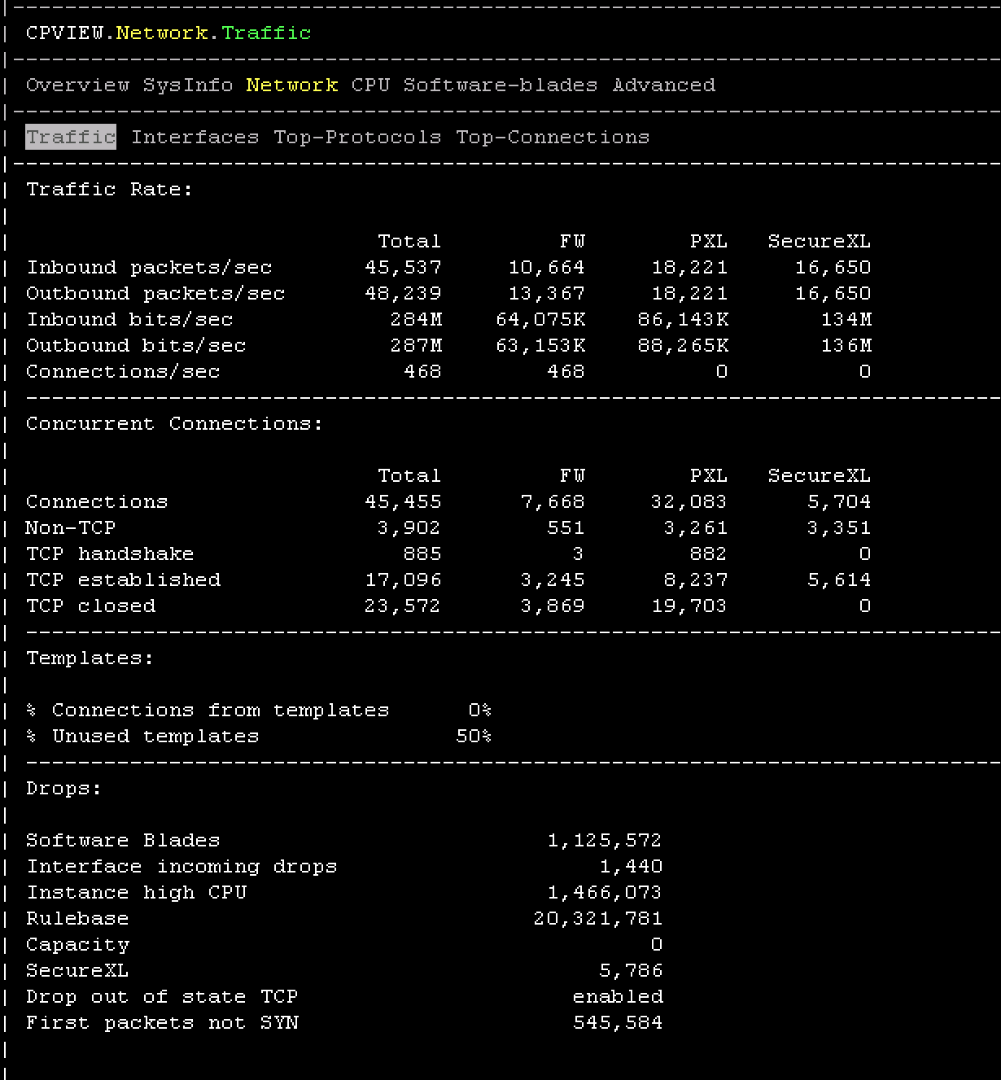
You may read and try yourself advance guide for SecureXL ATRG: SecureXL
But good start would be cpview tool and
- On the '
SysInfo' tab, refer to 'Configuration Information:' section - look at 'PPack Status' - On the '
Traffic' tab, go to 'Overview' menu - refer to section 'Templates:' - On the '
I/S' tab, go to 'SXL' menu - go to 'Overview' menu
- Mark as New
- Bookmark
- Subscribe
- Mute
- Subscribe to RSS Feed
- Permalink
- Report Inappropriate Content
Send a screenshot of rule 116 btw
- Mark as New
- Bookmark
- Subscribe
- Mute
- Subscribe to RSS Feed
- Permalink
- Report Inappropriate Content
It's said the Security policy #161?
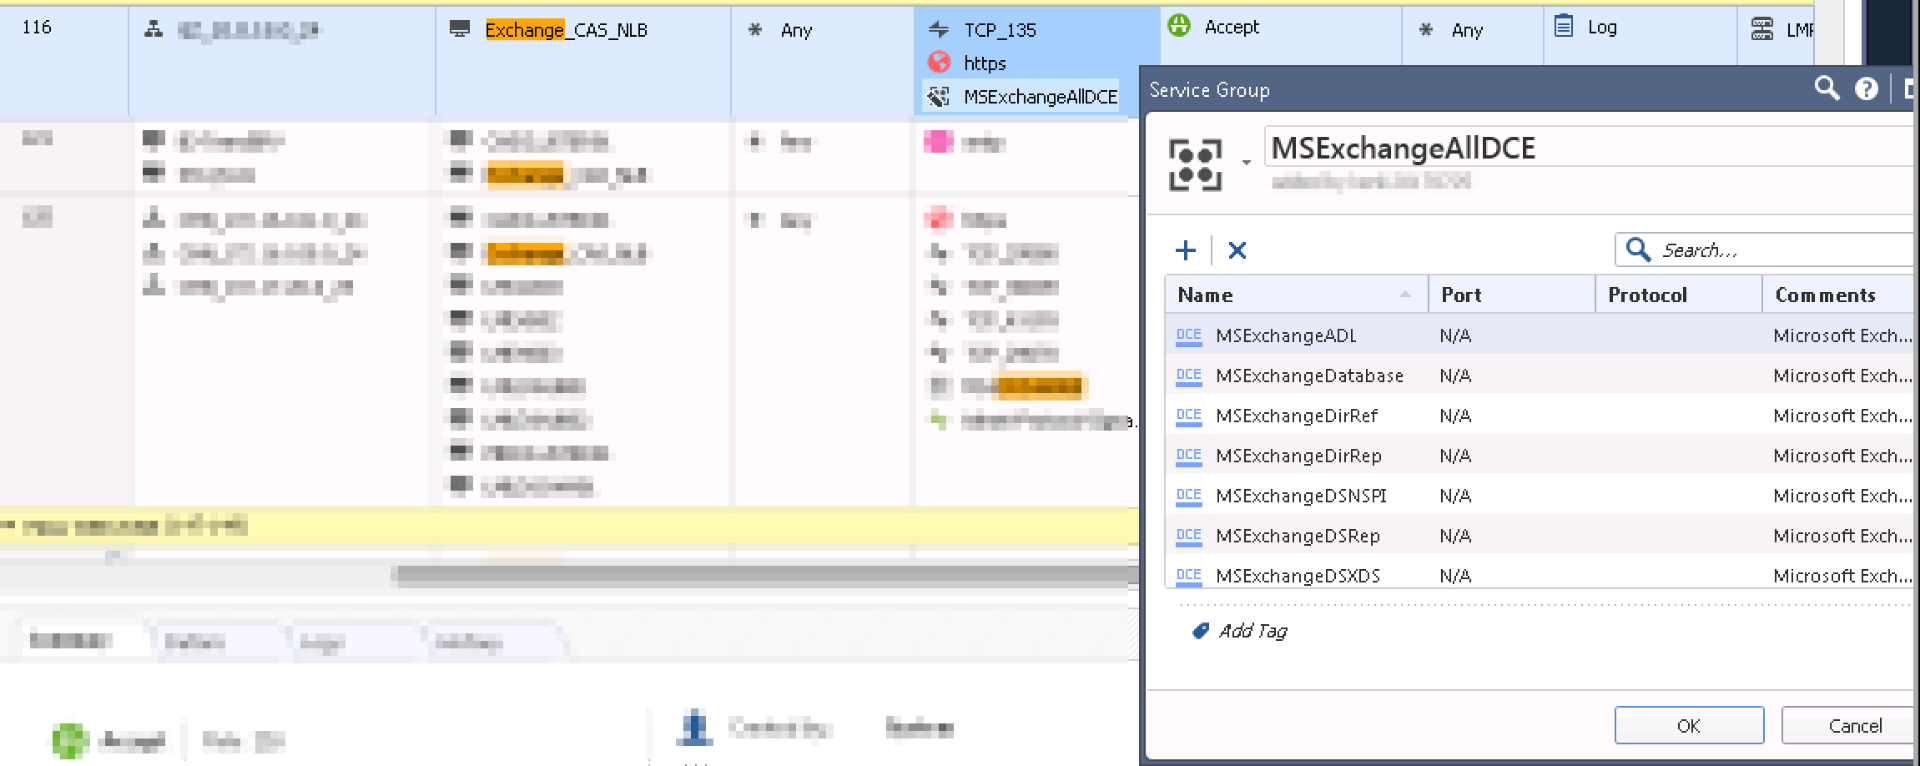
I have checked below link, seems DCE object apply the rule will disables template offloads?
- Mark as New
- Bookmark
- Subscribe
- Mute
- Subscribe to RSS Feed
- Permalink
- Report Inappropriate Content
Hi Kaspars
I haven't to see below tab on CPview, another i have to place below screencap, TKs
- On the '
I/S' tab, go to 'SXL' menu - go to 'Overview' menu
- Mark as New
- Bookmark
- Subscribe
- Mute
- Subscribe to RSS Feed
- Permalink
- Report Inappropriate Content
CPFW01> fwaccel stats
Name Value Name Value
-------------------- --------------- -------------------- ---------------
Accelerated Path
------------------------------------------------------------------------------
accel packets 160471423 accel bytes 167469799777
conns created 3814562 conns deleted 1053491
C total conns 45624 C templates 11
C TCP conns 41657 C delayed TCP conns 0
C non TCP conns 3967 C delayed nonTCP con 0
conns from templates 1676 temporary conns 88892
nat conns 308542 dropped packets 3977
dropped bytes 451401 nat templates 0
port alloc templates 0 conns from nat tmpl 0
port alloc conns 0 conns auto expired 2628231
Accelerated VPN Path
------------------------------------------------------------------------------
C crypt conns 0 enc bytes 0
dec bytes 0 ESP enc pkts 0
ESP enc err 0 ESP dec pkts 0
ESP dec err 0 ESP other err 0
AH enc pkts 0 AH enc err 0
AH dec pkts 0 AH dec err 0
AH other err 0 espudp enc pkts 0
espudp enc err 0 espudp dec pkts 0
espudp dec err 0 espudp other err 0
Medium Path
------------------------------------------------------------------------------
PXL packets 135464113 PXL async packets 136672627
PXL bytes 108840580526 C PXL conns 32255
C PXL templates 11 PXL FF conns 0
PXL FF packets 0 PXL FF bytes 0
PXL FF acks 0
Accelerated QoS Path
------------------------------------------------------------------------------
QXL packets 0 QXL async packets 0
QXL bytes 0 C QXL conns 0
C QXL templates 0
Firewall Path
------------------------------------------------------------------------------
F2F packets 32032418 F2F bytes 16895591711
C F2F conns 7666 TCP violations 51909
C partial conns 0 C anticipated conns 0
port alloc f2f 0 C no-match ranges 0
GTP
------------------------------------------------------------------------------
gtp tunnels created 0 gtp tunnels 0
gtp accel pkts 0 gtp f2f pkts 0
gtp spoofed pkts 0 gtp in gtp pkts 0
gtp signaling pkts 0 gtp tcpopt pkts 0
gtp apn err pkts 0
General
------------------------------------------------------------------------------
memory used 0 free memory 0
C used templates 9 pxl tmpl conns 1676
C conns from tmpl 12 C non TCP F2F conns 948
C tcp handshake conn 876 C tcp established co 16337
C tcp closed conns 24444 C tcp f2f handshake 3
C tcp f2f establishe 2791 C tcp f2f closed con 3924
C tcp pxl handshake 873 C tcp pxl establishe 7933
C tcp pxl closed con 20520 outbound packets 160464773
outbound pxl packets 135456528 outbound f2f packets 24844182
outbound bytes 169739647032 outbound pxl bytes 110801526847
outbound f2f bytes 12442754987
(*) Statistics marked with C refer to current value, others refer to total value
- Mark as New
- Bookmark
- Subscribe
- Mute
- Subscribe to RSS Feed
- Permalink
- Report Inappropriate Content
Hi Ben almost everything in the provided outputs looks OK. A few notes:
1) Main issue: All traffic through the firewall is not being accelerated at all and is F2F. This can most definitely cause latency if the Firewall Workers get overloaded, although the reported CPU loads are not indicating that, at least when you ran the various commands. ICMP traffic like ping always goes F2F.
2) SecureXL templating is being disabled at rule #116 but this is a minor issue, worst thing that happens is new connections might take a bit more CPU to start up. Don't worry about that for now.
3) Issue might still be something cluster-related especially given the reply from Christian Froemmel, try temporarily powering off the standby member and see if latency improves while it is off. Could possibly be a sync network health issue too.
4) For now the default 2/14 CoreXL split is fine since everything is getting handled on the Firewall Worker cores.
To diagnose 100% F2F and possible state sync network health issue, please provide output from these commands run on active cluster member in expert mode:
enabled_blades
fwaccel stats
fw ctl pstat
cphaprob syncstat
uptime
cpstat -f sensors os
free -m
Definitely not a ring buffer issue as that would cause loss, not latency. Next steps might include running the healthcheck.sh (sk121447) script and see if it flags anything interesting like excessive fragmentation.
--
Second Edition of my "Max Power" Firewall Book
Now Available at http://www.maxpowerfirewalls.com
Gaia 4.18 (R82) Immersion Tips, Tricks, & Best Practices Video Course
Now Available at https://shadowpeak.com/gaia4-18-immersion-course
Now Available at https://shadowpeak.com/gaia4-18-immersion-course
- Mark as New
- Bookmark
- Subscribe
- Mute
- Subscribe to RSS Feed
- Permalink
- Report Inappropriate Content
TKs Tim, here is the output
[Expert@CPFW01:0]# enabled_blades
fw urlf av appi ips identityServer SSL_INSPECT anti_bot ThreatEmulation
[Expert@CPFW01:0]# fwaccel stats
Name Value Name Value
-------------------- --------------- -------------------- ---------------
Accelerated Path
------------------------------------------------------------------------------
accel packets 10971533 accel bytes 10881228762
conns created 281540 conns deleted 83342
C total conns 54274 C templates 11
C TCP conns 48520 C delayed TCP conns 0
C non TCP conns 5754 C delayed nonTCP con 0
conns from templates 68 temporary conns 5197
nat conns 37659 dropped packets 2122
dropped bytes 1403606 nat templates 0
port alloc templates 0 conns from nat tmpl 0
port alloc conns 0 conns auto expired 138795
Accelerated VPN Path
------------------------------------------------------------------------------
C crypt conns 0 enc bytes 0
dec bytes 0 ESP enc pkts 0
ESP enc err 0 ESP dec pkts 0
ESP dec err 0 ESP other err 0
AH enc pkts 0 AH enc err 0
AH dec pkts 0 AH dec err 0
AH other err 0 espudp enc pkts 0
espudp enc err 0 espudp dec pkts 0
espudp dec err 0 espudp other err 0
Medium Path
------------------------------------------------------------------------------
PXL packets 20939149 PXL async packets 20961225
PXL bytes 17824614007 C PXL conns 37820
C PXL templates 11 PXL FF conns 0
PXL FF packets 0 PXL FF bytes 0
PXL FF acks 0
Accelerated QoS Path
------------------------------------------------------------------------------
QXL packets 0 QXL async packets 0
QXL bytes 0 C QXL conns 0
C QXL templates 0
Firewall Path
------------------------------------------------------------------------------
F2F packets 7842821 F2F bytes 6257780901
C F2F conns 10758 TCP violations 4938
C partial conns 0 C anticipated conns 0
port alloc f2f 0 C no-match ranges 0
GTP
------------------------------------------------------------------------------
gtp tunnels created 0 gtp tunnels 0
gtp accel pkts 0 gtp f2f pkts 0
gtp spoofed pkts 0 gtp in gtp pkts 0
gtp signaling pkts 0 gtp tcpopt pkts 0
gtp apn err pkts 0
General
------------------------------------------------------------------------------
memory used 0 free memory 0
C used templates 8 pxl tmpl conns 68
C conns from tmpl 11 C non TCP F2F conns 1803
C tcp handshake conn 897 C tcp established co 20467
C tcp closed conns 27156 C tcp f2f handshake 4
C tcp f2f establishe 3434 C tcp f2f closed con 5517
C tcp pxl handshake 893 C tcp pxl establishe 11464
C tcp pxl closed con 21639 outbound packets 10971188
outbound pxl packets 20938680 outbound f2f packets 5142398
outbound bytes 11035716018 outbound pxl bytes 18143138006
outbound f2f bytes 3107678342
(*) Statistics marked with C refer to current value, others refer to total value
[Expert@CPFW01:0]# fw ctl pstat
System Capacity Summary:
Memory used: 12% (5921 MB out of 48212 MB) - below watermark
Concurrent Connections: 57009 (Unlimited)
Aggressive Aging is enabled, not active
Hash kernel memory (hmem) statistics:
Total memory allocated: 5054136320 bytes in 1233920 (4096 bytes) blocks using 1 pool
Total memory bytes used: 0 unused: 5054136320 (100.00%) peak: 2756680360
Total memory blocks used: 0 unused: 1233920 (100%) peak: 733422
Allocations: 1145856212 alloc, 0 failed alloc, 1096600625 free
System kernel memory (smem) statistics:
Total memory bytes used: 7805087932 peak: 8076265368
Total memory bytes wasted: 71386285
Blocking memory bytes used: 103077536 peak: 163787628
Non-Blocking memory bytes used: 7702010396 peak: 7912477740
Allocations: 312393977 alloc, 0 failed alloc, 312360558 free, 0 failed free
vmalloc bytes used: 7664364412 expensive: no
Kernel memory (kmem) statistics:
Total memory bytes used: 5081329656 peak: 5577620876
Allocations: 1458168653 alloc, 0 failed alloc
1408885327 free, 0 failed free
External Allocations: 22963200 for packets, 149193801 for SXL
Cookies:
1114189080 total, 600527512 alloc, 600523974 free,
201337983 dup, 2076159519 get, 1135704466 put,
298974987 len, 93016759 cached len, 0 chain alloc,
0 chain free
Connections:
64331966 total, 53985293 TCP, 7850461 UDP, 2427772 ICMP,
68440 other, 17374 anticipated, 488674 recovered, 57003 concurrent,
86581 peak concurrent
Fragments:
185498800 fragments, 92747635 packets, 1117 expired, 0 short,
0 large, 0 duplicates, 2102 failures
NAT:
161628816/0 forw, 168142838/0 bckw, 329010726 tcpudp,
664550 icmp, 6570599-37226090 alloc
Sync:
Version: new
Status: Able to Send/Receive sync packets
Sync packets sent:
total : 106679404, retransmitted : 6388, retrans reqs : 6318, acks : 110757
Sync packets received:
total : 494233458, were queued : 145401, dropped by net : 7138
retrans reqs : 3462, received 532353 acks
retrans reqs for illegal seq : 0
dropped updates as a result of sync overload: 2343
Callback statistics: handled 234246 cb, average delay : 1, max delay : 4126
[Expert@CPFW01:0]# cphaprob syncstat
Sync Statistics (IDs of F&A Peers - 1 😞
Other Member Updates:
Sent retransmission requests................... 6336
Avg missing updates per request................ 32
Old or too-new arriving updates................ 494325080
Unsynced missing updates....................... 2129
Lost sync connection (num of events)........... 1146
Timed out sync connection ..................... 20
Local Updates:
Total generated updates ....................... 117689009
Recv Retransmission requests................... 3582
Recv Duplicate Retrans request................. 2582
Blocking Events................................ 0
Blocked packets................................ 0
Max length of sending queue.................... 0
Avg length of sending queue.................... 0
Hold Pkts events............................... 235515
Unhold Pkt events.............................. 235515
Not held due to no members..................... 465
Max held duration (sync ticks)................. 0
Avg held duration (sync ticks)................. 0
Timers:
Sync tick (ms)................................. 100
CPHA tick (ms)................................. 100
Queues:
Sending queue size............................. 512
Receiving queue size........................... 256
[Expert@CPFW01:0]# uptime
09:20:17 up 10 days, 8:05, 2 users, load average: 8.37, 8.78, 7.87
[Expert@CPFW01:0]# cpstat -f sensors os
Temperature Sensors
------------------------------------------------
|Name |Value|Unit |Type |Status|
------------------------------------------------
|System Temp 2|33.88|Celsius|Temperature| 0|
|System Temp 1|44.00|Celsius|Temperature| 0|
|CPU1 TEMP |35.00|Celsius|Temperature| 0|
|CPU0 TEMP |39.13|Celsius|Temperature| 0|
------------------------------------------------
Fan Speed Sensors
---------------------------------------
|Name |Value |Unit|Type|Status|
---------------------------------------
|System Fan 4|7417.00|RPM |Fan | 0|
|System Fan 3|7258.00|RPM |Fan | 0|
|System Fan 2|7458.00|RPM |Fan | 0|
|System Fan 1|7258.00|RPM |Fan | 0|
---------------------------------------
Voltage Sensors
-----------------------------------------------
|Name |Value|Unit|Type |Status|
-----------------------------------------------
|Vbat |3.33 |Volt|Voltage| 0|
|5VSB |5.05 |Volt|Voltage| 0|
|3VSB |3.27 |Volt|Voltage| 0|
|1.5V |0.95 |Volt|Voltage| 0|
|VCC 5V |5.03 |Volt|Voltage| 0|
|VCC |3.31 |Volt|Voltage| 0|
|+12V |11.90|Volt|Voltage| 0|
|CPU1 DDR3-2 Voltage|1.50 |Volt|Voltage| 0|
|CPU1 DDR3-1 Voltage|1.50 |Volt|Voltage| 0|
|CPU0 DDR3-2 Voltage|1.50 |Volt|Voltage| 0|
|CPU0 DDR3-1 Voltage|1.50 |Volt|Voltage| 0|
|Vcore1 |0.95 |Volt|Voltage| 0|
|Vcore0 |0.96 |Volt|Voltage| 0|
-----------------------------------------------
[Expert@CPFW01:0]# free -m
total used free shared buffers cached
Mem: 64282 19089 45193 0 718 5431
-/+ buffers/cache: 12939 51343
Swap: 18449 0 18449
- Mark as New
- Bookmark
- Subscribe
- Mute
- Subscribe to RSS Feed
- Permalink
- Report Inappropriate Content
> Fragments:
> 185498800 fragments, 92747635 packets, 1117 expired, 0 short,
> 0 large, 0 duplicates, 2102 failures
Gah, this seems like a rather large number of fragments for a firewall that has only been up 10 days, although I don't have recent netstat numbers to compare against. Fragmented traffic cannot be accelerated at all which can easily cause 100% F2F if you have a misconfigured MTU between the firewall and an adjacent Layer 3 device. This is covered in my book in the section "IP Fragmentation: Nemesis of SecureXL".
Use the tcpdump filter below to view all fragmented traffic in real-time. You really need to fix your MTU values assuming these fragments are coming from a part of the network you control. I didn't see any other big red flags in the command outputs you provided.
tcpdump -eni any '((ip[6:2] > 0) and (not ip[6] = 64))'
--
Second Edition of my "Max Power" Firewall Book
Now Available at http://www.maxpowerfirewalls.com
Gaia 4.18 (R82) Immersion Tips, Tricks, & Best Practices Video Course
Now Available at https://shadowpeak.com/gaia4-18-immersion-course
Now Available at https://shadowpeak.com/gaia4-18-immersion-course
- Mark as New
- Bookmark
- Subscribe
- Mute
- Subscribe to RSS Feed
- Permalink
- Report Inappropriate Content
Hi Tim
You are right if use your tcpdump command and show the result. Let arrange the timeslot tuning MTU first. TKs for your advice.

PS. Anyway, I process to purchase your book right now
- Mark as New
- Bookmark
- Subscribe
- Mute
- Subscribe to RSS Feed
- Permalink
- Report Inappropriate Content
For point 3) Issue might still be something cluster-related especially given the reply from Christian Froemmel, try temporarily powering off the standby member and see if latency improves while it is off. Could possibly be a sync network health issue too.
We try it before but haven't improve.
- Mark as New
- Bookmark
- Subscribe
- Mute
- Subscribe to RSS Feed
- Permalink
- Report Inappropriate Content
Most bizarre! First timer round fwaccel stats -s showed only F2F packets but now it seems to be working OK from latest fwaccell and cpview stats!

You can definitely see CPU overload causing packet loss in cpview output, that would indicate that some conditions push it over the limit
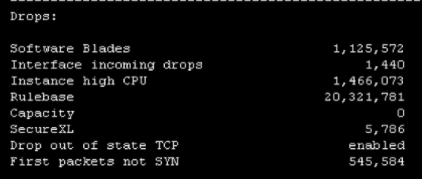
Is it possible that SecureXL is being turned on/off intermittently by some fault condition that triggers high CPU and latency as a result?
Would have to check messages log for some indication. But I guess case is with TAC so they will have full picture ![]()
- Mark as New
- Bookmark
- Subscribe
- Mute
- Subscribe to RSS Feed
- Permalink
- Report Inappropriate Content
Oh, we haven't change config. no idea why working now...
- Mark as New
- Bookmark
- Subscribe
- Mute
- Subscribe to RSS Feed
- Permalink
- Report Inappropriate Content
I know Tim is much smarter than I am when i comes to firewalls and he said that rule 116 is not a big problem, but if that's an option I would disable rule 116 for short while and see what happens.:)
Else you need to check /var/log/messages for any indication that SecureXL / acceleration is having any issues
- Mark as New
- Bookmark
- Subscribe
- Mute
- Subscribe to RSS Feed
- Permalink
- Report Inappropriate Content
Hi Kaspars,
If fwaccel stats -s is accidentally run on the standby cluster member, it will always report 100% F2F because all traffic it is handling is from/to itself, which is never accelerated by SecureXL.
--
Second Edition of my "Max Power" Firewall Book
Now Available at http://www.maxpowerfirewalls.com
Gaia 4.18 (R82) Immersion Tips, Tricks, & Best Practices Video Course
Now Available at https://shadowpeak.com/gaia4-18-immersion-course
Now Available at https://shadowpeak.com/gaia4-18-immersion-course
- Mark as New
- Bookmark
- Subscribe
- Mute
- Subscribe to RSS Feed
- Permalink
- Report Inappropriate Content
Hi Ben,
Have you contact our support ?
if so, Please share SR#....
Best regards
Eyal Rashelbach
R80 Desk Manager | Solution Center | Check Point Software Technologies
Leaderboard
Epsum factorial non deposit quid pro quo hic escorol.
| User | Count |
|---|---|
| 22 | |
| 18 | |
| 11 | |
| 8 | |
| 7 | |
| 4 | |
| 3 | |
| 3 | |
| 3 | |
| 3 |
Upcoming Events
Thu 08 Jan 2026 @ 05:00 PM (CET)
AI Security Masters Session 1: How AI is Reshaping Our WorldThu 22 Jan 2026 @ 05:00 PM (CET)
AI Security Masters Session 2: Hacking with AI: The Dark Side of InnovationThu 12 Feb 2026 @ 05:00 PM (CET)
AI Security Masters Session 3: Exposing AI Vulnerabilities: CP<R> Latest Security FindingsThu 26 Feb 2026 @ 05:00 PM (CET)
AI Security Masters Session 4: Powering Prevention: The AI Driving Check Point’s ThreatCloudThu 08 Jan 2026 @ 05:00 PM (CET)
AI Security Masters Session 1: How AI is Reshaping Our WorldThu 22 Jan 2026 @ 05:00 PM (CET)
AI Security Masters Session 2: Hacking with AI: The Dark Side of InnovationThu 26 Feb 2026 @ 05:00 PM (CET)
AI Security Masters Session 4: Powering Prevention: The AI Driving Check Point’s ThreatCloudAbout CheckMates
Learn Check Point
Advanced Learning
YOU DESERVE THE BEST SECURITY
©1994-2025 Check Point Software Technologies Ltd. All rights reserved.
Copyright
Privacy Policy
About Us
UserCenter


