Create a Post
cancel
Showing results for 
Search instead for 
Did you mean: 
Sorin_Gogean
Advisor

Cluster Capacity - peak/concurrent connections

Hello everyone,


Not sure why, lately we had seen an increase in memory utilization (like it doubled) and I was able to determine that it's due to some traffic spikes. 

Memory utilization, it jumped from ~45% utilization to ~80% . Our GWs are 15600 with 32Gb memory (and quite some blades). 

So, I tried to identify what traffic caused that, see some sources/destinations or anything that can get us close to a conclusion.


Sadly I wasn't lucky enough to get anywhere, therefore I come here asking for some guidance.


In order to prevent this, I looked for a way to limit concurrent connections per IP/client, but I'm not yet there (using fwaccel dos rate ) so any hints are wellcomed.


Here is how fw ctl pstat results show on a node... that "1145453 peak concurrent" bothers me 😁 - wth 1mil ?!?!?!?!


Roughly, I look for a way to get some reports, either from the Manager or from the box itself when the connections are over 500K (some value) to get the list of the connection table that I can work with and get some data out of it - still 500K or 1Mil .... 


ALVA-FW01

ALVA-FW01> fw ctl pstat


System Capacity Summary:

  Memory used: 48% (11578 MB out of 23889 MB) - below watermark

  Concurrent Connections: 54553 (Unlimited)

  Aggressive Aging is enabled, not active


Hash kernel memory (hmem) statistics:

  Total memory allocated: 13925134336 bytes in 3399691 (4096 bytes) blocks using 11 pools

  Initial memory allocated: 2503999488 bytes (Hash memory extended by 11421134848 bytes)

  Memory allocation  limit: 20039335936 bytes using 512 pools

  Total memory bytes  used:        0   unused: 13925134336 (100.00%)   peak: 14058217444

  Total memory blocks used:        0   unused:  3399691 (100%)   peak:  3592449

  Allocations: 3826885158 alloc, 0 failed alloc, 3801372538 free


System kernel memory (smem) statistics:

  Total memory  bytes  used: 19378365776   peak: 20195144584

  Total memory bytes wasted: 95203288

    Blocking  memory  bytes   used: 69845532   peak: 110230372

    Non-Blocking memory bytes used: 19308520244   peak: 20084914212

  Allocations: 580197892 alloc, 0 failed alloc, 580126896 free, 0 failed free

  vmalloc bytes  used: 19216527896 expensive: no


Kernel memory (kmem) statistics:

  Total memory  bytes  used: 8419234052   peak: 16326533036

  Allocations: 112078525 alloc, 0 failed alloc

               86508537 free, 0 failed free

  External Allocations:

    Packets: 66761920, SXL: 0, Reorder: 0

    Zeco: 0, SHMEM: 94392, Resctrl: 0

    ADPDRV: 0, PPK_CI: 0, PPK_CORR: 0


Cookies:

        397638576 total, 394223007 alloc, 394212203 free,

        4272844296 dup, 621658599 get, 2526281133 put,

        2705746389 len, 2027218867 cached len, 0 chain alloc,

        0 chain free


Connections:

        673523638 total, 296395981 TCP, 359631398 UDP, 17496203 ICMP,

        56 other, 39952 anticipated, 195487 recovered, 54554 concurrent,

        1145453 peak concurrent


Fragments:

        8688744 fragments, 4341654 packets, 14 expired, 0 short,

        0 large, 0 duplicates, 0 failures


NAT:

        2579202207/0 forw, 2673121164/0 bckw, 6811102365 tcpudp,

        33611286 icmp, 358817824-291829883 alloc


Sync: Run "cphaprob syncstat" for cluster sync statistics.


ALVA-FW01>


A TAC will be opened on Monday....

0 Kudos
9 Replies
Timothy_Hall
Legend Legend
Legend

Almost certainly some kind of internal auditor running a port scan from the inside that is mostly accepted by the firewall, or perhaps an overly-aggressive internal Network Monitoring System doing probing.  Only way to figure out who it is would be looking at traffic logs.  They key is that a flood of connections like this have to be accepted to run up the connections table like that, so they probably came from the inside as a scan from the outside would be mostly dropped and never create entries in the connections table at all. 

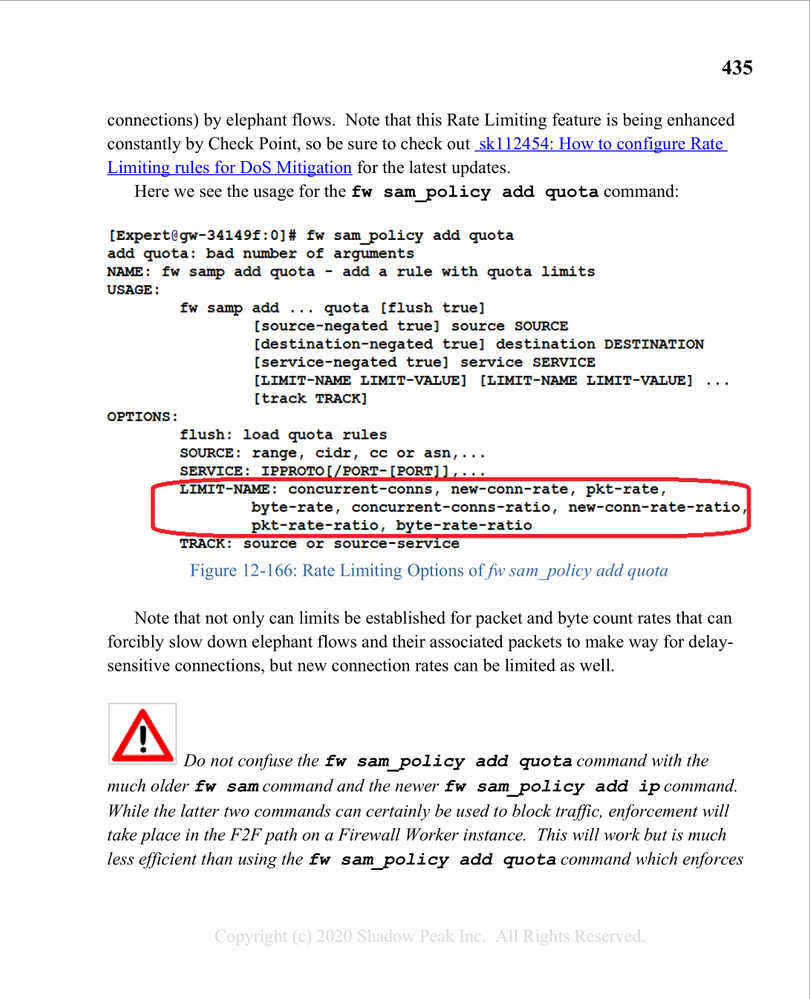
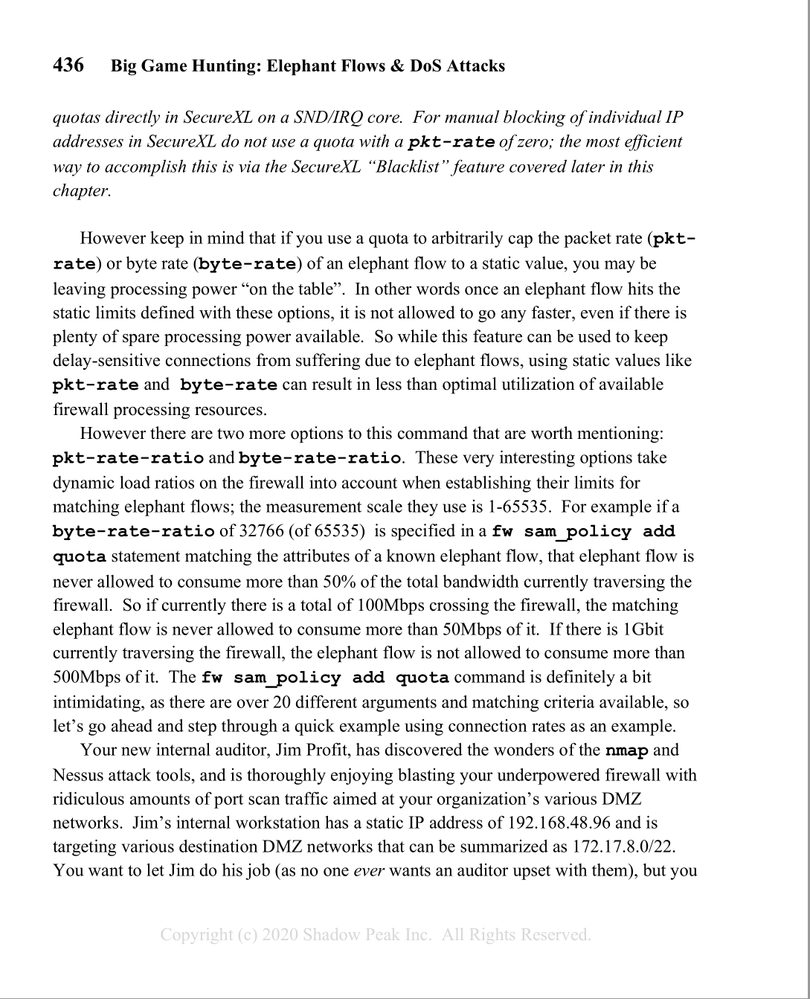
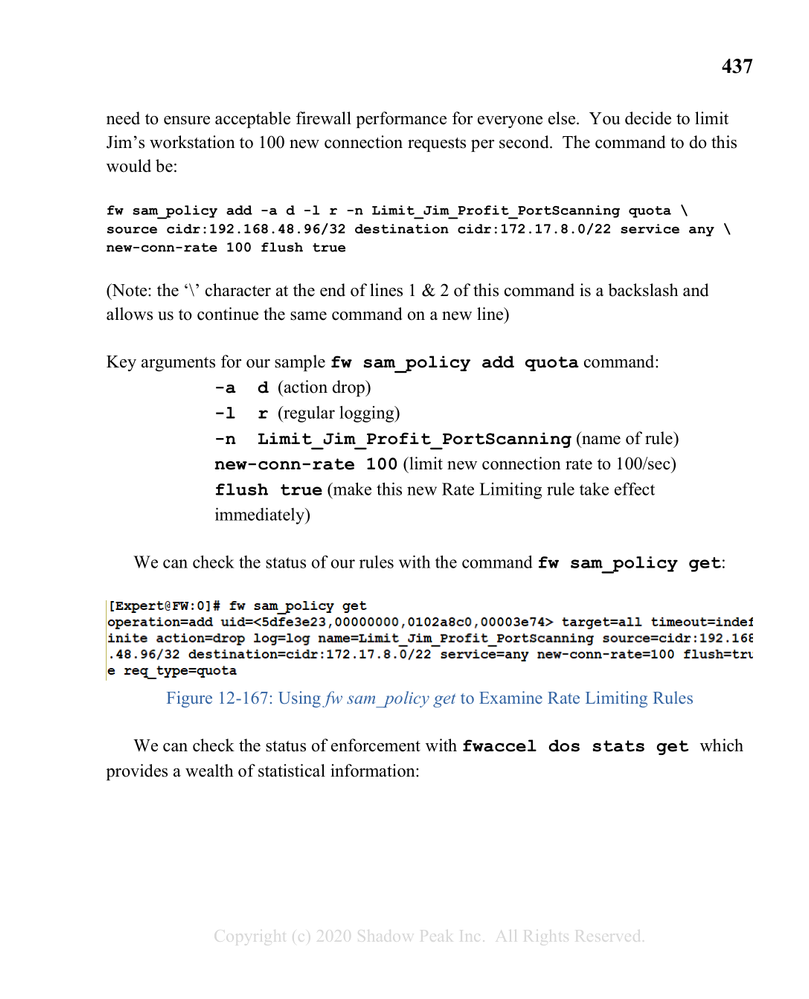
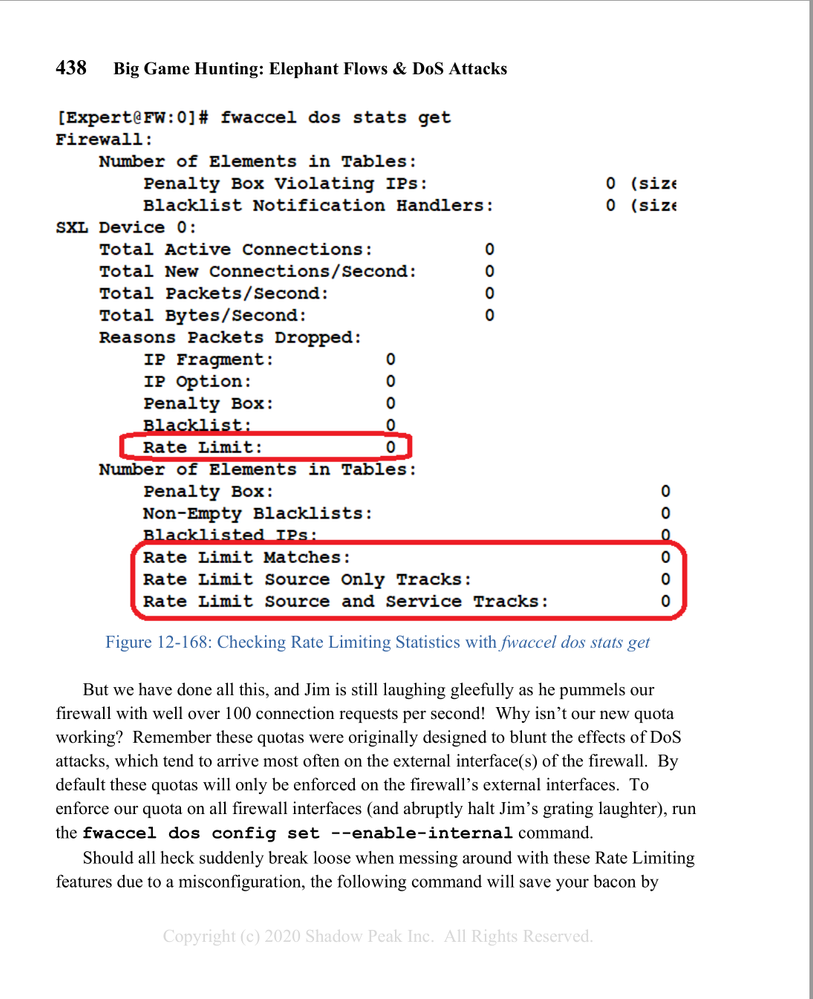
This situation was covered in my book, note that the fw samp/fw sam_policy command has been deprecated since the book was published and you should use the equivalent  fwaccel dos command in R80.40+.

auditor1.pngauditor2.pngauditor3.pngauditor4.pngauditor5.png


Gateway Performance Optimization R81.20 Course
now available at maxpowerfirewalls.com
0 Kudos
Juan_
Collaborator

Also from your book, OP could use this command whilst the connections are on the table:


fw tab -u -t connections |awk '{ print $2 }'|sort -n |uniq -c|sort -nr|head -10

This handy command will provide an output something like this:

12322 0a1e0b53

212 0a1e0b50


Then translate hex to IP


0 Kudos
Sorin_Gogean
Advisor

Hello @Juan_ ,


Thank you for that, I'm using already below commands that are triggered when I get over 150K concurrent connections in order to determine source or destination IP with the most connections. 

(the -f provides the IP's in "human readable" form) (time is used to measure how loong it takes to process the whole table - whatever size it is)

time (fw tab -u -t connections -f |awk '{print $19}' |grep -v "+" |grep -v "^$" | sed 's/;/ /g' | sort -n | uniq -c | sort -nr | head -n 10)
time (fw tab -u -t connections -f |awk '{print $23}' |grep -v "+" |grep -v "^$" | sed 's/;/ /g' | sort -n | uniq -c | sort -nr | head -n 10)


With this I got smth like I show below, pointing that our external DNS server 213.6x.yy2.xx7 is getting the attention from time to time:

STARTED AT: Sun May 29 01:54:16 CEST 2022
Current connections count: 434177
Begin listing TOP 10 SRC conenctions: Sun May 29 01:54:16 CEST 2022
647748 213.6x.yy2.xx7

STARTED AT: Wed Jun 1 12:16:51 CEST 2022
Current connections count: 330492
Begin listing TOP 10 SRC conenctions: Wed Jun 1 12:16:52 CEST 2022
86756 213.6x.yy2.xx7

STARTED AT: Fri Jun 3 12:53:17 CEST 2022
Current connections count: 448174
Begin listing TOP 10 SRC conenctions: Fri Jun 3 12:53:25 CEST 2022
121168 213.6x.yy2.xx7


Thank you,


Sorin_Gogean
Advisor

Hello @Timothy_Hall 


Thank you for pointing that out 😉 .

I already had some "fwaccel dos rules" that are set in monitor mode - just to catch what/where when it happens.


Like I told Juan, we manage to identify one of our external DNS servers being too used from time to time, so I just added the following rule, and we'll watch it for next days . If we're reaching to a good value, we'll change the -a n (notify) to an -a b (block) .

"fwaccel dos rate add -a n -l r -n "F5_DNSWatch" destination cidr:213.6x.yy2.xx7/32 service 17/53 new-conn-rate 500 track source"


My main problem is, I have hard time determining a good "new-conn-rate" per service .

Secondly, I wonder how this "fwaccel dos rate" works in conjunction with fast_accel; would it be catch by "dos rate" limit or ?

fw ctl fast_accel add any 213.6x.yy2.xx7 53 17


(we did this in the past, as I wanted to take the DNS out of the inspection and send it to the other box - not convinced is the best aproach) 


Thank you and have a nice week,

0 Kudos
Timothy_Hall
Legend Legend
Legend

Yeah DNS is a tricky one as far as new-conn-rate since UDP doesn't have connections per se but the firewall tries to track it that way; recursive lookups do cause a lot of rapid-fire DNS "connections" and setting the rate limit too low can cause intermittent DNS failures, which then can cause all kinds of strange annoying problems.  I think your approach of monitoring it for awhile to come up with a reasonable rate limit is a good one.

All fast_accel does is force non-F2F traffic into the SecureXL fully-accelerated path for handling; doing so should not affect the enforcement of fwaccel dos commands as my understanding is that they are checked first in sim/SecureXL before any further processing by sim or a Firewall Worker.

Gateway Performance Optimization R81.20 Course
now available at maxpowerfirewalls.com
0 Kudos
Sorin_Gogean
Advisor

Hello,


Just coming back with some updates.

We've taken 2 decisions, first was to lower the UDP 53 port timer from 40 sec to 10 sec for the rule(s) that were allowing external access to our public DNS, and watching the traffic for a while, we've see that this made the "attacks" lower in current session, we went from 600K (some weeks ago) to ~200-250K after we applied the lower UDP53 .

Now that we manage to diminish this, we also set some fwaccel dos new-conn-rate rules with a limit of 100 new connections per second. This was kicking in when we've got new High DNS traffic, and we noticed that the timeframe of the "attack" got shorter .


Hopefully it will help you too.


Ty,

Sorin_Gogean
Advisor

Hello, 


@Timothy_Hall and @PhoneBoy , I want to ask you (and all others) for some hints, as we did applied some fwaccel dos rate with new-conn-rate set to 100. 

All is good and we see that the limitation kicks in, but we don't see the pbox being triggered for this DOS Rate Limit traffic drops.

So any hint on what/where we could monitor and see/understand why the DOS Rate Limit is not triggering the Pbox and get the IP's into ?


Ty,

0 Kudos
Timothy_Hall
Legend Legend
Legend

By default the penalty box will only apply to traffic traversing an interface defined as external, if you want it applied to all traffic you need to run fwaccel dos config set --enable-internal.  Also make sure you have the penalty box feature enabled and not just configured with fwaccel dos config set --enable-pbox.

Gateway Performance Optimization R81.20 Course
now available at maxpowerfirewalls.com
0 Kudos
Sorin_Gogean
Advisor

hey @Timothy_Hall 


Pbox is enabled internally also, still the DNS problem were facing comes from external interface towards Public DMZ .

It can be that the 500packets/sec is not getting triggered by the "new-conn-rate 100" ? 

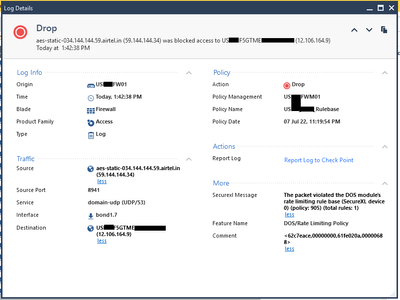
As in the CKP Logs we can clearly see that traffic gets dropped for DOS/RateLimit - like for this below we see ~200 drops in logs for the last hour.

This is why I asked for some extra hints 🙂 .

Untitled.png


[Expert@ALVA-FW01:0]# fwaccel dos pbox -m

Penalty box monitor_only: "on"

[Expert@ALVA-FW01:0]# fwaccel dos config get

    rate limit: enabled (with policy)

    rule cache: enabled

          pbox: enabled

     deny list: enabled (with policy)

    drop frags: disabled

     drop opts: disabled

      internal: enabled

       monitor: disabled

     log drops: enabled

      log pbox: enabled

    notif rate: 100 notifications/second

     pbox rate: 500 packets/second

      pbox tmo: 180 seconds

[Expert@ALVA-FW01:0]#


Ty,

0 Kudos

Leaderboard

Epsum factorial non deposit quid pro quo hic escorol.

Upcoming Events

    CheckMates Events