- Products
- Learn
- Local User Groups
- Partners
- More

This website uses Cookies. Click Accept to agree to our website's cookie use as described in our Privacy Policy. Click Preferences to customize your cookie settings.
- Products
- Learn
- Local User Groups
- Upcoming Events
- Americas
- EMEA
- Czech Republic and Slovakia
- Denmark
- Netherlands
- Germany
- Sweden
- United Kingdom and Ireland
- France
- Spain
- Norway
- Ukraine
- Baltics and Finland
- Greece
- Portugal
- Austria
- Kazakhstan and CIS
- Switzerland
- Romania
- Turkey
- Belarus
- Belgium & Luxembourg
- Russia
- Poland
- Georgia
- DACH - Germany, Austria and Switzerland
- Iberia
- Africa
- Adriatics Region
- Eastern Africa
- Israel
- Nordics
- Middle East and Africa
- Balkans
- Italy
- Bulgaria
- Cyprus
- APAC
- Partners
- More
- ABOUT CHECKMATES & FAQ
- Sign In
- Leaderboard
- Events
Step Into the Future of
AI-Powered Cyber Security
The State of Ransomware Q1 2026
Key Trends and Their Impact
AI Security Masters E8:
Claude Mythos: New Era in Cyber Security
Blueprint Architecture for Securing
The AI Factory & AI Data Center
Call For Papers
Your Expertise. Our Stage
CheckMates Go:
CheckMates Fest
Turn on suggestions
Auto-suggest helps you quickly narrow down your search results by suggesting possible matches as you type.
Showing results for
- CheckMates
- :
- Products
- :
- Hybrid Mesh
- :
- Skyline
- :
- Re: how to ingest skyline data into splunk
Options
- Subscribe to RSS Feed
- Mark Topic as New
- Mark Topic as Read
- Float this Topic for Current User
- Bookmark
- Subscribe
- Mute
- Printer Friendly Page
Turn on suggestions
Auto-suggest helps you quickly narrow down your search results by suggesting possible matches as you type.
Showing results for
Are you a member of CheckMates?
×
Sign in with your Check Point UserCenter/PartnerMap account to access more great content and get a chance to win some Apple AirPods! If you don't have an account, create one now for free!
- Mark as New
- Bookmark
- Subscribe
- Mute
- Subscribe to RSS Feed
- Permalink
- Report Inappropriate Content
Jump to solution
how to ingest skyline data into splunk
Dear Fellow Checkmates,
Since I was missing an Splunk integration in sk178566, I put together some details for you.
Find below a quick Guide to add Skyline Metrics into Splunk Metric Index on a single instance Splunk server.

Prerequisites for a single instance Splunk installation:
- Install Splunk (Follow Instructions here)
- Install Prometheus App for Splunk https://splunkbase.splunk.com/app/4077
- create an metric type index to use e.g. skyline_prometheus_metric
Configuration of Splunk as receiver:
Create Input to listen for Otel data:
Create inputs.conf inside /opt/splunk/etc/apps/modinput_prometheus/local/inputs.conf with following settings:
[prometheusrw]
port = 8098
maxClients = 10
disabled = 0
[prometheusrw://skyline_via_prometheus_metric]
bearerToken = ABC123
index = skyline_prometheus_metric
sourcetype = prometheus:metric
whitelist = *
Now restart splunk, and check for port 8098 listening.
Check Point Skyline Configuration to send metrics:
Create config.yml with the following content, it will be used in the next step:
{
"enabled": true,
"export-targets": {"add": [
{
"client-auth": {
"token": {
"header-bearer-token": "ABC123"
}
},
"enabled": true,
"type": "prometheus-remote-write",
"url": http://splunk.lab.local:8098
}
]}
}
Finaly configure CPotelcol:
/opt/CPotelcol/REST.py --set_open_telemetry “$(cat config.yml)”
On Splunk UI to see the metrics preview:
| mpreview index=skyline_prometheus_metric
To see latest ClusterXL details for example:
| mstats latest(cluster_xl_members_state) as state WHERE index="skyline_prometheus_metric" by host_name,name,id
For details about splunk metric search language refer to:
https://docs.splunk.com/Documentation/Splunk/9.0.4/Metrics/Search
Final Hint: To get proper mapping of clusterxl description, I extracted the lookup from prometheus dashboards provided by Check Point.
Enjoy, and if there are any questions let me know.
1 Solution
Accepted Solutions
- Mark as New
- Bookmark
- Subscribe
- Mute
- Subscribe to RSS Feed
- Permalink
- Report Inappropriate Content
Thanks @Elad_Chomsky and @Bob_Zimmerman for the assistance - I've resolved the issue by updating the Security Gateways on VM from Hotfix R81.20 Jumbo Take 53 to R81.20 Jumbo Take 65. No other changes were required on the Payload.Json file.
15 Replies
- Mark as New
- Bookmark
- Subscribe
- Mute
- Subscribe to RSS Feed
- Permalink
- Report Inappropriate Content
Wow, thats impressive work @Markus_Malits , thank you very much for sharing! 👍💪
Best,
Andy
"Have a great day and if its not, change it"
Andy
"Have a great day and if its not, change it"
- Mark as New
- Bookmark
- Subscribe
- Mute
- Subscribe to RSS Feed
- Permalink
- Report Inappropriate Content
Its always nice to see put true professional effort to help others, its so valuable.
Vielen Dank @Markus_Malits
Best,
Andy
"Have a great day and if its not, change it"
Andy
"Have a great day and if its not, change it"
- Mark as New
- Bookmark
- Subscribe
- Mute
- Subscribe to RSS Feed
- Permalink
- Report Inappropriate Content
Hi @Markus_Malits - could you please assist me configuring the above solution:
I'm encountering an issue with ingesting data from a Prometheus remote_write_agent into Splunk Enterprise – this solution utilises the ‘Prometheus Metrics for Splunk and is within a Test Environment.
Details:
Splunk Version: Splunk Enterprise 9.2 (Trial License)
Operating System: Ubuntu 22.04
Splunk Application: Prometheus Metrics for Splunk (Latest Version 1.0.1)
Configuration and troubleshooting completed:
1) Splunk Enterprise installed
2) Installed latest compatible version of Prometheus App for Splunk https://splunkbase.splunk.com/app/4077
3) Created a metric type index to use: 'prometheus' - ensured it was enabled
4) Configured inputs.conf (/opt/splunk/etc/apps/modinput_prometheus/local/inputs.conf) to meet the configuration parameters within the inputs.spec.conf (/opt/splunk/etc/apps/modinput_prometheus/README/inputs.conf.spec)
I copied this chunk from the examples in the modinput_prometheus/default/inputs.conf file to ensure no syntax errors.

5) Confirmed the port 8098 State had changed to Listen
6) Created the config.yml and according to formatting structure above

However, there appeared to be a syntax error (potentially the ]} causing this error to be returned:

7) Configured and Ran CPotelcol - ran command /opt/CPotelcol/REST.py --set_open_telemetry “$(cat /opt/CPotelcol/config.yml)” - Result: TypeError: <lambda> ( ) missing 1 required positional argument 'val'

I am not able to change the config.yml file to match the JSON payload for Splunk - connection without TLS in Skyline Configuration on Check Point Servers that run Gaia OS - Other Monitoring Tools
I have also tried to isolate the issue with the config.yml by investigating the /opt/CPotecol/REST.py but have been unsuccessful.
Could you please advise on what needs to be fixed to be able to configure the config.yml file correctly, thank you very much.
- Mark as New
- Bookmark
- Subscribe
- Mute
- Subscribe to RSS Feed
- Permalink
- Report Inappropriate Content
Hi @Network007 ,
Please review the admin guide, with then new deployment method ( skyline configuration tool ) - you should be able to interact with Splunk directly.
https://sc1.checkpoint.com/documents/Appliances/Skyline/Content/Topics-AG/Introduction.htm
- Mark as New
- Bookmark
- Subscribe
- Mute
- Subscribe to RSS Feed
- Permalink
- Report Inappropriate Content
Thank you Elad for pointing Network007 in the right direction.
Using PrometheusWrite is still possible, but HEC Input is more convinient, and does not require the addon.
cheers
Markus
- Mark as New
- Bookmark
- Subscribe
- Mute
- Subscribe to RSS Feed
- Permalink
- Report Inappropriate Content
If possible could you please share a working example of what a correct no-tls-payload.json file is configured as for a Splunk Enterprise HTTP Event Collector.
- Mark as New
- Bookmark
- Subscribe
- Mute
- Subscribe to RSS Feed
- Permalink
- Report Inappropriate Content
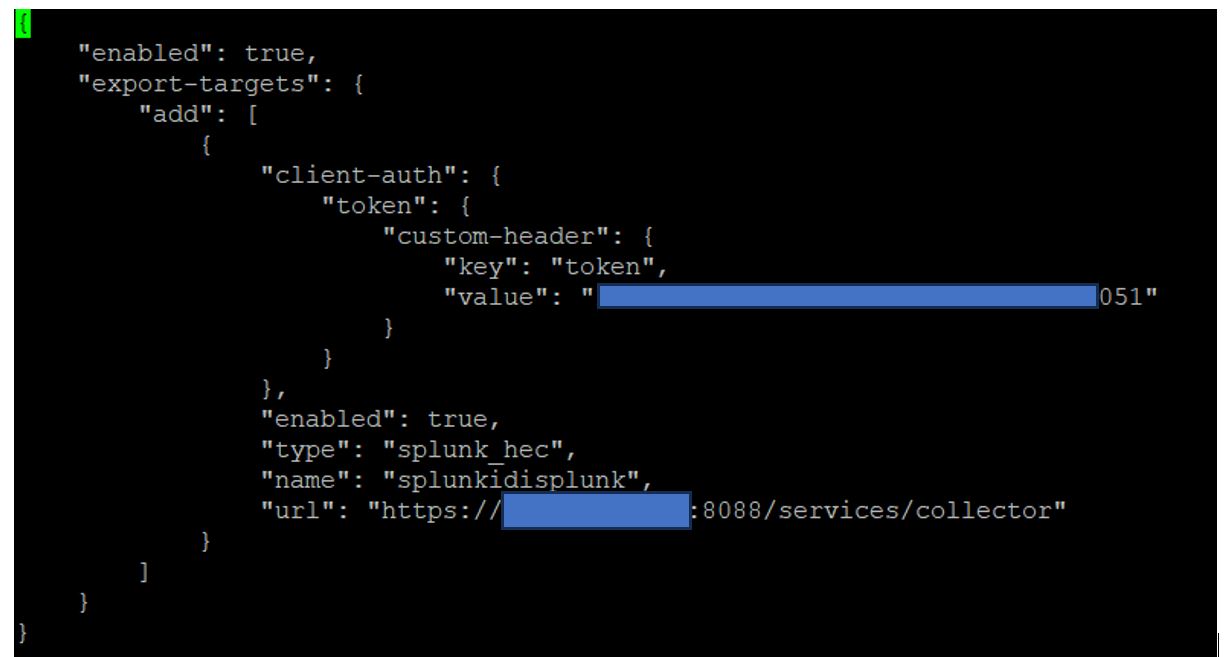
Example payload attached:
{
    "enabled": true,
    "export-targets": {
        "add": [
            {
                "client-auth": {
                    "token": {
                        "custom-header": {
                            "key": "token",
                            "value": "<YOUR_HEC_TOKEN>"
                        }
                    }
                },
                "enabled": true,
                "type": "splunk_hec",
                "name": "splunkidisplunk",
                "url": "https://<FQDN_or_IP_of_SPLUNK_SERVER>:8088/services/collector"
            }
        ]
    }
}
|
- Mark as New
- Bookmark
- Subscribe
- Mute
- Subscribe to RSS Feed
- Permalink
- Report Inappropriate Content
Hi @Elad_Chomsky ,
I've done a clean install of a new gateway on a VM and applied the Recommended Jumbo Hotfix. Could you please advise what this error might mean and how to resolve it - error returned:... http: server gave HTTP response to HTTPS client


Thanks.
- Mark as New
- Bookmark
- Subscribe
- Mute
- Subscribe to RSS Feed
- Permalink
- Report Inappropriate Content
That means the client sent a Client Hello, and the server responded with a cleartext HTTP response instead of a Server Hello. You can either set up TLS on the server side or change the URL on the client side to not attempt to use TLS.
- Mark as New
- Bookmark
- Subscribe
- Mute
- Subscribe to RSS Feed
- Permalink
- Report Inappropriate Content
Hi @Network007 ,
1) Try without the '/services/collector' part it might be a mismatch on documentation from our side.
2) As @Bob_Zimmerman, align the HTTP and HTTPS, according to whether your server supports TLS.
- Mark as New
- Bookmark
- Subscribe
- Mute
- Subscribe to RSS Feed
- Permalink
- Report Inappropriate Content
Thanks @Elad_Chomsky and @Bob_Zimmerman for the assistance - I've resolved the issue by updating the Security Gateways on VM from Hotfix R81.20 Jumbo Take 53 to R81.20 Jumbo Take 65. No other changes were required on the Payload.Json file.
- Mark as New
- Bookmark
- Subscribe
- Mute
- Subscribe to RSS Feed
- Permalink
- Report Inappropriate Content
Is there a way to change the value of the "index" key Check Point sends? For example, here is an OpenTelemetry data point:
{
  "time": 1719862567.27,
  "host": "DallasSA",
  "source": "otel",
  "sourcetype": "otel",
  "index": "main",
  "event": "metric",
  "fields": {
    "service.name": "CPviewExporter",
    "service.namespace": "vs_id_0",
    "service.version": "CPviewExporter-0.1.0",
    "name": "cp_mgmt",
    "type": "IPv4",
    "metric_name:vsx.core_xl.count": 2,
    "metric_type": "Gauge"
  }
}
The team which runs my company's telemetry aggregation infrastructure wants us to send to the index "check_point". I don't find any documentation on how to change that from "main" to something else.
- Mark as New
- Bookmark
- Subscribe
- Mute
- Subscribe to RSS Feed
- Permalink
- Report Inappropriate Content
Hi @Bob_Zimmerman ,
It looks like according to the official documentation it should be done using a processor, please open an RFE for CheckPoint, so we will see if we can add this feature to the roadmap.
- Mark as New
- Bookmark
- Subscribe
- Mute
- Subscribe to RSS Feed
- Permalink
- Report Inappropriate Content
I may be experiencing a similar issue - just to confirm have you been able to configure Splunk to ingest the skyline a different Index instead of defaulting to the Main index?
- Mark as New
- Bookmark
- Subscribe
- Mute
- Subscribe to RSS Feed
- Permalink
- Report Inappropriate Content
Hi Markus, could you please explain if you have been able to utilise the Skyline JSON dashboards within Splunk, and if so, what was the process to update the dashboards from the Grafana focused configuration?
Skyline Dashboards:Telemetry - Check Point CheckMates
Leaderboard
Epsum factorial non deposit quid pro quo hic escorol.
| User | Count |
|---|---|
| 2 | |
| 1 |
Upcoming Events
Tue 19 May 2026 @ 06:00 PM (IDT)
AI Security Masters E8 - Claude Mythos: New Era in Cyber SecurityWed 20 May 2026 @ 11:00 AM (CEST)
The New DDoS Reality: Autonomy, Scale, and the Future of DefenceTue 19 May 2026 @ 06:00 PM (IDT)
AI Security Masters E8 - Claude Mythos: New Era in Cyber SecurityWed 20 May 2026 @ 11:00 AM (CEST)
The New DDoS Reality: Autonomy, Scale, and the Future of DefenceFri 29 May 2026 @ 09:00 AM (EDT)
Caracas: Executive Breakfast: Innovación en Ciberseguridad – IA y Threat IntelligenceAbout CheckMates
Learn Check Point
Advanced Learning
YOU DESERVE THE BEST SECURITY

©1994-2026 Check Point Software Technologies Ltd. All rights reserved.
Copyright
Privacy Policy
About Us
UserCenter