- Products
- Learn
- Local User Groups
- Partners
- More
This website uses Cookies. Click Accept to agree to our website's cookie use as described in our Privacy Policy. Click Preferences to customize your cookie settings.
- Products
- Learn
- Local User Groups
- Upcoming Events
- Americas
- EMEA
- Czech Republic and Slovakia
- Denmark
- Netherlands
- Germany
- Sweden
- United Kingdom and Ireland
- France
- Spain
- Norway
- Ukraine
- Baltics and Finland
- Greece
- Portugal
- Austria
- Kazakhstan and CIS
- Switzerland
- Romania
- Turkey
- Belarus
- Belgium & Luxembourg
- Russia
- Poland
- Georgia
- DACH - Germany, Austria and Switzerland
- Iberia
- Africa
- Adriatics Region
- Eastern Africa
- Israel
- Nordics
- Middle East and Africa
- Balkans
- Italy
- Bulgaria
- Cyprus
- APAC
- Partners
- More
- ABOUT CHECKMATES & FAQ
- Sign In
- Leaderboard
- Events
The State of Ransomware Q1 2026
Key Trends and Their Impact
Good, Better, Best:
Prioritizing Defenses Against Credential Abuse
AI Security Masters E7:
How CPR Broke ChatGPT's Isolation and What It Means for You
Blueprint Architecture for Securing
The AI Factory & AI Data Center
Call For Papers
Your Expertise. Our Stage
CheckMates Go:
CheckMates Fest
Turn on suggestions
Auto-suggest helps you quickly narrow down your search results by suggesting possible matches as you type.
Showing results for
- CheckMates
- :
- Products
- :
- Hybrid Mesh
- :
- Firewall and Security Management
- :
- SmartLog only look back 14 days - how to reindex 9...
Options
- Subscribe to RSS Feed
- Mark Topic as New
- Mark Topic as Read
- Float this Topic for Current User
- Bookmark
- Subscribe
- Mute
- Printer Friendly Page
Turn on suggestions
Auto-suggest helps you quickly narrow down your search results by suggesting possible matches as you type.
Showing results for
Are you a member of CheckMates?
×
Sign in with your Check Point UserCenter/PartnerMap account to access more great content and get a chance to win some Apple AirPods! If you don't have an account, create one now for free!
- Mark as New
- Bookmark
- Subscribe
- Mute
- Subscribe to RSS Feed
- Permalink
- Report Inappropriate Content
Jump to solution
SmartLog only look back 14 days - how to reindex 90 days back?
Hi
I have a challenge with Mgmt log indexing in R80.10 take 56.
In my SmartLog I can only look 14 days back in time, but in folder /opt/CPsuite-R80/fw1/log/ there are logs back to August 2017.
How can I index the old logs so they are included in SmartLog?
I have found sk77640 (SmartLog does not index logs that existed prior to SmartLog installation) but does not include R80.10.
Any suggestions?
Thanks
Kim
Best Regards
Kim
Kim
1 Solution
Accepted Solutions
- Mark as New
- Bookmark
- Subscribe
- Mute
- Subscribe to RSS Feed
- Permalink
- Report Inappropriate Content
Hello guys,
If any of you are still having trouble re-indexing logs, here is the solution for each version.
| Version | R80, R80.10, R80.20 |
R80.x SmartLog/SmartEvent server doesn't index/show logs older than 1-14 days back
| Version | R76, R77, R77.10, R77.20, R77.30 |
SmartLog does not index logs that existed prior to SmartLog installation
| Version | R75.40, R75.40VS, R75.45, R75.46, R76 |
SmartLog does not index log files that were moved back to log directory - Specific Scenario
12 Replies
- Mark as New
- Bookmark
- Subscribe
- Mute
- Subscribe to RSS Feed
- Permalink
- Report Inappropriate Content
Hi,
I am not sure about R80.10 but we have done following things in R77.30 for the same issue.
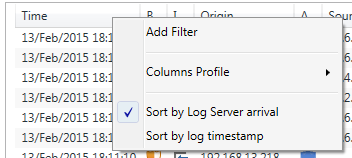
If you right click on Header, There are options like "sort by Log server arrival" or "Sort by log timestamp". You can select "sort by log timestamp"

Please check if same options are there in R80.10
- Mark as New
- Bookmark
- Subscribe
- Mute
- Subscribe to RSS Feed
- Permalink
- Report Inappropriate Content
To index the older log files, follow the steps in the R80.10 docs for importing Offline Log Files:
- R80 Logging and Monitoring Administration Guide - Chapter "Getting Started" - section "Importing Offline Log Files" - subsection "Importing Log Files from SmartEvent Servers"
- Mark as New
- Bookmark
- Subscribe
- Mute
- Subscribe to RSS Feed
- Permalink
- Report Inappropriate Content
Dameon,
Where should I insert the extra line for let it index more than 90 days?
$INDEXERDIR/log_indexer_custom_settings.conf
(
:data ("/opt/CPrt-R80/log_indexer/data")
:server_port ("127.0.0.1:18244")
:dns_resolving (true)
:dns_backresolving (true)
:connections (
:domain (
:management (
:name (127.0.0.1)
:uuid ()
:log_files (all)
:is_local (true)
:read_mode (CPMI)
)
:log_servers (
: (
:name (127.0.0.1)
:uuid ()
:log_files (all)
:folder ("/opt/CPsuite-R80/fw1/log")
:is_local (true)
:read_mode (FILES)
)
)
)
)
:max_disk_space_usage (0)
)
I have tried to add :num_days_restriction_for_fetch_all_integrated (90) it before or after :max_disk_space_usage (0). But in the link to the guide, one have to remove two lines first which doesn't exist in my situation.
Any hints what do look after?
Thanks
Best Regards
Kim
Kim
- Mark as New
- Bookmark
- Subscribe
- Mute
- Subscribe to RSS Feed
- Permalink
- Report Inappropriate Content
I think you can put it after dns_backresolving.
Or you can try what https://community.checkpoint.com/people/simone996b1d2-bee9-3af1-a14a-7f918695c76d suggested above ![]()
- Mark as New
- Bookmark
- Subscribe
- Mute
- Subscribe to RSS Feed
- Permalink
- Report Inappropriate Content
Follow sk98894 - Run SmartEvent Offline Jobs for multiple log files"
FYI : The doctor-log script should be able to pick up any of the errors during the reindexing, it will also check the status of the other SmartEvent components, it may be worthwhile.
$RTDIR/scripts/doctor-log.sh -f
- Mark as New
- Bookmark
- Subscribe
- Mute
- Subscribe to RSS Feed
- Permalink
- Report Inappropriate Content
Simon,
I have tried to run the command, before and after changing the file $INDEXERDIR/log_indexer_custom_settings.conf but it keeps telling there is an error with my SmartEvent.
[Expert@gwmgmt:0]# $RTDIR/scripts/doctor-log.sh -f
Initializing...
*** Detailed Diagnostics Results ***
System Status : Attention (79% of disk in use)
Changes in Config Files : OK
Load Average : Medium(>2.0)
Check Processes : OK
Correlation Unit Status : OK
Correlation Units Config : OK
Connections Config : OK
GW's and Log Clients : Warning
Problems in Debug Log Files : Error
Rfl/Solr Memory Report : OK
Log Indexes : OK
Maintenance Configuration : OK
Smart View Status : Error
Total Logs Number : OK
Logging/Indexing Rates : OK
Indexing Status : OK
Query Solr Logs by Product : OK
System Info:
Machine type : VM
Version : R80.10
Branch : R80_10_jumbo_hf
Take : 421
Hotfix : HOTFIX_R80_10, HOTFIX_R80_10_JUMBO_HF take_56
Is Upgraded : Yes
Management : Smart Center + Smart Event
Pre R80 Dbsync : Yes
System Status:
OS Ver : 64-bit
CPUs : 4
Total Memory : 15917 Mb
Free Memory : 7146 Mb
Used Disk Mb : 312G
Used Disk % : 79%
Logging/Indexing Rates:
Rates metrics is logs per second
Logging Rate : 47
Indexing Rate : 55
Issues Found:
----------------------------
System Status:
WARNING : Used over 70% of disk space
Check Processes:
Attention : Found core dumps for CPSEAD
Attention : Found core dumps for CPSEMD
Attention : Found core dumps for CPD
GW's and Log Clients:
WARNING : Possible Monitoring issue:
gw1 Last Login Time is Wed Dec 13 13:56:22 2017
WARNING : Possible Monitoring issue:
gw2-de Last Login Time is Wed Dec 13 14:39:09 2017
WARNING : Possible Monitoring issue:
GW1-PL Last Login Time is Thu Jan 4 19:44:21 2018
WARNING : Possible Monitoring issue:
GW1-RO Last Login Time is Thu Jan 4 19:42:51 2018
WARNING : Possible Monitoring issue:
GW1-SE Last Login Time is Thu Jan 4 09:13:20 2018
WARNING : Possible Monitoring issue:
gw1-de Last Login Time is Wed Dec 13 14:15:29 2017
WARNING : Possible Monitoring issue:
gw2 Last Login Time is Wed Dec 13 13:58:48 2017
Problems in Debug Log Files:
WARNING : Found total of 6 occurrences of exception indicators in the last 1 hours
In "/opt/CPrt-R80/log/solr.log"
ERROR : [15 Jan 17:13:24] - Indexer failed to connect Solr. Solr process is down, or not listening for connections on local machine
WARNING : Found total of 108 occurrences of exception indicators in the last 1 hours
In "/opt/CPrt-R80/log_indexer/log/log_indexer.elg"
Smart View Status:
ERROR : Found a large number of exception indicators (54) in smartview
WARNING : Found total of 2 occurrences of exception indicators in the last 1 hours
In "/opt/CPrt-R80/log/smartview-service.log"
Summary:
Found 2 Errors, 11 Warnings in this running configuration.
Detailed report and more can be found under /tmp/sme-diag/results
*** Diagnostic Completed ***
I have restored the file vi $INDEXERDIR/log_indexer_custom_settings.conf back to before I changed it.
cp $INDEXERDIR/log_indexer_custom_settings.conf_orig $INDEXERDIR/log_indexer_custom_settings.conf
Thanks
Kim
Best Regards
Kim
Kim
- Mark as New
- Bookmark
- Subscribe
- Mute
- Subscribe to RSS Feed
- Permalink
- Report Inappropriate Content
Not too sure if you resolved it already, but check if indexer is not stuck at some specific log. Check sk112336 for details how. Or there is one-liner here https://community.checkpoint.com/message/11199-how-to-quickly-check-log-indexing-backlog
I have seen odd behaviour when queue gets stuck, but doesn't sound like your case
- Mark as New
- Bookmark
- Subscribe
- Mute
- Subscribe to RSS Feed
- Permalink
- Report Inappropriate Content
I wasn't able to get it solve yet..
It is still an open issue, but I hope I will soon manage to get deeper into what the problem is.
Best Regards
Kim
Kim
- Mark as New
- Bookmark
- Subscribe
- Mute
- Subscribe to RSS Feed
- Permalink
- Report Inappropriate Content
Hi Kim,
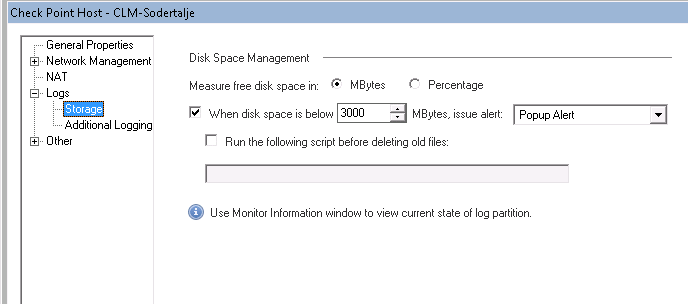
I've just found this with in the general settings of our primary management server.

Hope this helps you?
- Mark as New
- Bookmark
- Subscribe
- Mute
- Subscribe to RSS Feed
- Permalink
- Report Inappropriate Content
That option is removed from MDS/CMA/CLM env ![]()

- Mark as New
- Bookmark
- Subscribe
- Mute
- Subscribe to RSS Feed
- Permalink
- Report Inappropriate Content
Good to know! Our environment is just a single domain.
- Mark as New
- Bookmark
- Subscribe
- Mute
- Subscribe to RSS Feed
- Permalink
- Report Inappropriate Content
Hello guys,
If any of you are still having trouble re-indexing logs, here is the solution for each version.
| Version | R80, R80.10, R80.20 |
R80.x SmartLog/SmartEvent server doesn't index/show logs older than 1-14 days back
| Version | R76, R77, R77.10, R77.20, R77.30 |
SmartLog does not index logs that existed prior to SmartLog installation
| Version | R75.40, R75.40VS, R75.45, R75.46, R76 |
SmartLog does not index log files that were moved back to log directory - Specific Scenario
Leaderboard
Epsum factorial non deposit quid pro quo hic escorol.
| User | Count |
|---|---|
| 34 | |
| 10 | |
| 10 | |
| 10 | |
| 10 | |
| 8 | |
| 7 | |
| 6 | |
| 6 | |
| 6 |
Upcoming Events
Tue 12 May 2026 @ 10:00 AM (CEST)
The Cloud Architects Series: Check Point Cloud Firewall delivered as a serviceWed 13 May 2026 @ 11:00 AM (EDT)
TechTalk: The State of Ransomware Q1 2026: Key Trends and Their ImpactThu 14 May 2026 @ 07:00 PM (EEST)
Under the Hood: Presentando Check Point Cloud Firewall como ServicioTue 12 May 2026 @ 10:00 AM (CEST)
The Cloud Architects Series: Check Point Cloud Firewall delivered as a serviceAbout CheckMates
Learn Check Point
Advanced Learning
YOU DESERVE THE BEST SECURITY
©1994-2026 Check Point Software Technologies Ltd. All rights reserved.
Copyright
Privacy Policy
About Us
UserCenter


