- CheckMates
- :
- Products
- :
- Quantum
- :
- Management
- :
- Re: High I/O queue size and wait
- Subscribe to RSS Feed
- Mark Topic as New
- Mark Topic as Read
- Float this Topic for Current User
- Bookmark
- Subscribe
- Mute
- Printer Friendly Page
Are you a member of CheckMates?
×- Mark as New
- Bookmark
- Subscribe
- Mute
- Subscribe to RSS Feed
- Permalink
- Report Inappropriate Content
High I/O queue size and wait
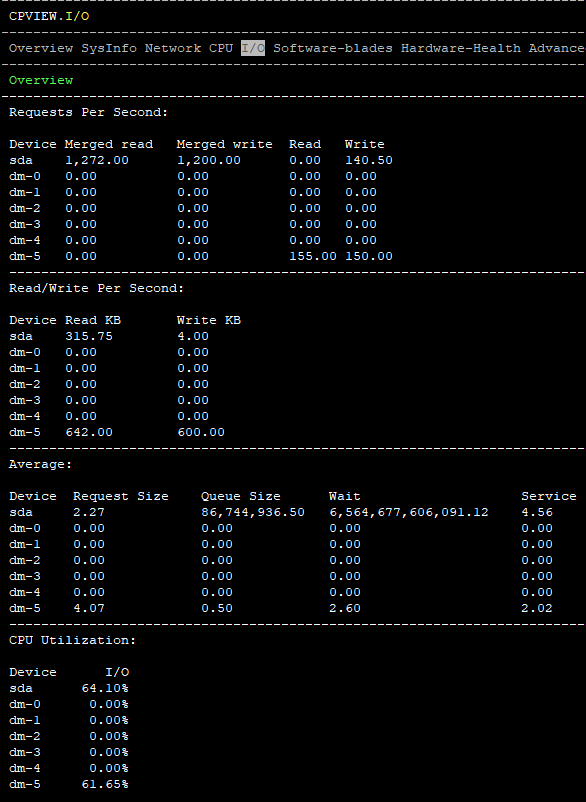
I'm trying to do some optimization on my 5400 units, as we are usually at over 80% CPU and memory utilization, even hitting swap memory. While doing some digging in cpview I found that my I/O average changes quickly between about a 1000 wait and 7,000,000,000,000 wait. Absurdly large. also very large queue size of ~ 80,000,000
What should I do with this information?
- Mark as New
- Bookmark
- Subscribe
- Mute
- Subscribe to RSS Feed
- Permalink
- Report Inappropriate Content
The 5400 only shipped with 8GB of RAM by default so you are probably low on free memory, please post output of:
enabled_blades
free -m
CET (Europe) Timezone Course Scheduled for July 1-2
- Mark as New
- Bookmark
- Subscribe
- Mute
- Subscribe to RSS Feed
- Permalink
- Report Inappropriate Content
Hi Tim,
We are defnitley low on RAM, with the default 8gb, we've dipped in to swap, I'v already received quotes for getting our RAM increased.
# enabled_blades
fw vpn cvpn urlf av aspm appi ips identityServer SSL_INSPECT anti_bot ThreatEmulation content_awareness vpn Scrub
# free -m
total used free shared buffers cached
Mem: 7744 7651 93 0 182 1080
-/+ buffers/cache: 6388 1356
Swap: 18394 624 17769
- Mark as New
- Bookmark
- Subscribe
- Mute
- Subscribe to RSS Feed
- Permalink
- Report Inappropriate Content
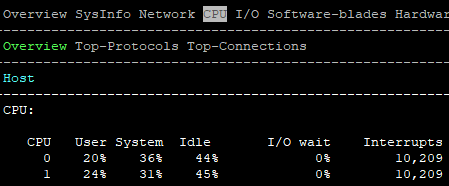
Looks like you have pretty much all the blades enabled, and the output of free -m confirms that the box is a bit short on memory. More RAM will definitely help here, particularly to increase buffering/caching for your hard disk. The 5400 only has two cores, so your next bottleneck after the RAM upgrade will probably be CPU but tuning should be able to mitigate some of that.
CET (Europe) Timezone Course Scheduled for July 1-2
- Mark as New
- Bookmark
- Subscribe
- Mute
- Subscribe to RSS Feed
- Permalink
- Report Inappropriate Content
Yes we definitely do have a CPU bottleneck as well. If only upgrading the CPU was as easy as RAM!
- Mark as New
- Bookmark
- Subscribe
- Mute
- Subscribe to RSS Feed
- Permalink
- Report Inappropriate Content
Tuning can help with CPU load, I think there might be some new book that came out covering that very topic.
CET (Europe) Timezone Course Scheduled for July 1-2
- Mark as New
- Bookmark
- Subscribe
- Mute
- Subscribe to RSS Feed
- Permalink
- Report Inappropriate Content
I've done some tuning, mostly with the access and threat prevention policies, following the optimization and best practices guides. I'm Hoping to not disable any blades we've purchased.
Would that be your new book that came out the other day? I've been wanting to read some of the books you've published.
- Mark as New
- Bookmark
- Subscribe
- Mute
- Subscribe to RSS Feed
- Permalink
- Report Inappropriate Content
Yep that's the one, I was just being facetious. Need to work on my writing skills when it comes to humor...
CET (Europe) Timezone Course Scheduled for July 1-2
- Mark as New
- Bookmark
- Subscribe
- Mute
- Subscribe to RSS Feed
- Permalink
- Report Inappropriate Content
David,
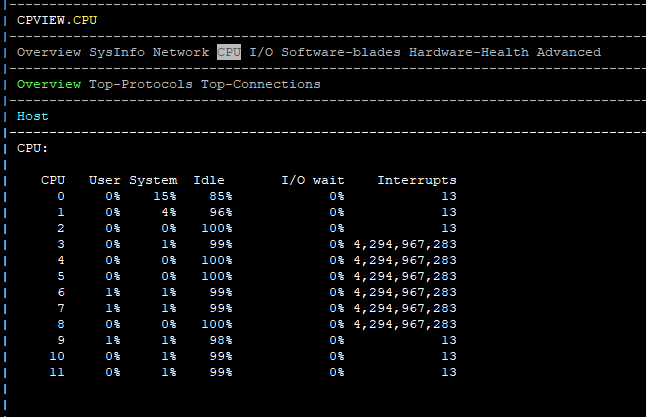
Hope you are doing fine, two weeks ago I saw a similar behavior in a 21400 cluster running R80.20 but with CPU interrupts, they went from 10 to billions in seconds. No increases in the CPU load overall.
I opened a TAC case for this and they told that it was cosmetic only, then I went to /proc/interrupts and it was fine.
My guess is that when CPUs are under load CPView may lead to some funny numbers.
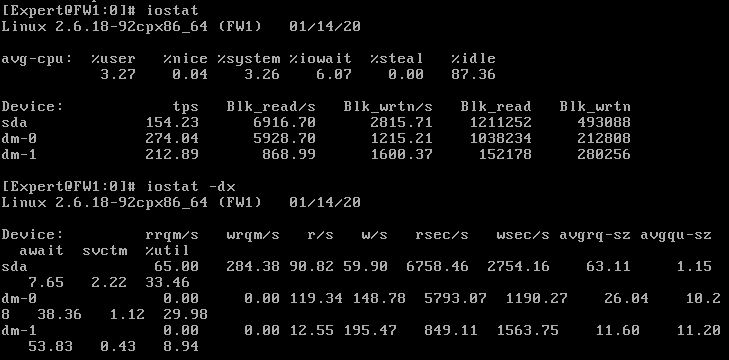
I recommend you to use iostat and iostats -dx
There are more flags to play with, just look online and you will find many helpful examples.
Regards,
https://www.linkedin.com/in/federicomeiners/
- Mark as New
- Bookmark
- Subscribe
- Mute
- Subscribe to RSS Feed
- Permalink
- Report Inappropriate Content
Hi Federico,
It does seem to be a cosmetic issue influenced by load. I've added some screenshots and snippets showing some of our stats. These shots are during our low hours, not peaks. I'll try looking up some examples to get some context.
iosat does show some pretty high numbers to me, although I don't have context as to what should be high vs standard
avg-cpu: %user %nice %system %iowait %steal %idle
9.04 0.00 19.27 1.27 0.00 70.41
Device: tps Blk_read/s Blk_wrtn/s Blk_read Blk_wrtn
sda 30.08 117.48 1001.37 273467536 2330947372
dm-0 0.00 0.00 0.00 2184 0
dm-1 0.00 0.00 0.00 2184 0
dm-2 0.00 0.00 0.00 2184 0
dm-3 44.97 49.72 330.68 115731914 769748608
dm-4 0.00 0.00 0.00 2184 0
dm-5 85.85 67.31 670.01 156672602 1559622128
iostat -dx
Device: rrqm/s wrqm/s r/s w/s rsec/s wsec/s avgrq-sz avgqu-sz await svctm %util
sda 0.31 100.55 5.48 24.61 117.48 1001.42 37.19 1.31 43.65 1.30 3.91
dm-0 0.00 0.00 0.00 0.00 0.00 0.00 8.00 0.00 5.59 5.59 0.00
dm-1 0.00 0.00 0.00 0.00 0.00 0.00 8.00 0.00 4.93 4.35 0.00
dm-2 0.00 0.00 0.00 0.00 0.00 0.00 8.00 0.00 5.34 5.05 0.00
dm-3 0.00 0.00 3.63 41.34 49.72 330.73 8.46 0.53 11.81 0.49 2.19
dm-4 0.00 0.00 0.00 0.00 0.00 0.00 8.00 0.00 5.41 4.83 0.00
dm-5 0.00 0.00 2.10 83.75 67.30 670.01 8.59 1.52 17.68 0.25 2.19
- Mark as New
- Bookmark
- Subscribe
- Mute
- Subscribe to RSS Feed
- Permalink
- Report Inappropriate Content
Hi David,
If you don't feel any HW-I/O related performance impact on the Gateway, then It looks cosmetic & should be okay.
but if you do, then feel free to give us a shout...