- Products
Network & SASE IoT Protect Maestro Management OpenTelemetry/Skyline Remote Access VPN SASE SD-WAN Security Gateways SmartMove Smart-1 Cloud SMB Gateways (Spark) Threat PreventionCloud Cloud Network Security CloudMates General CloudGuard - WAF Talking Cloud Podcast Weekly ReportsSecurity Operations Events External Risk Management Incident Response Infinity Portal NDR Playblocks SOC XDR/XPR Threat Exposure Management
- Learn
- Local User Groups
- Partners
- More

This website uses Cookies. Click Accept to agree to our website's cookie use as described in our Privacy Policy. Click Preferences to customize your cookie settings.
- Products
- AI Security
- Developers & More
- Check Point Trivia
- CheckMates Toolbox
- General Topics
- Products Announcements
- Threat Prevention Blog
- Upcoming Events
- Americas
- EMEA
- Czech Republic and Slovakia
- Denmark
- Netherlands
- Germany
- Sweden
- United Kingdom and Ireland
- France
- Spain
- Norway
- Ukraine
- Baltics and Finland
- Greece
- Portugal
- Austria
- Kazakhstan and CIS
- Switzerland
- Romania
- Turkey
- Belarus
- Belgium & Luxembourg
- Russia
- Poland
- Georgia
- DACH - Germany, Austria and Switzerland
- Iberia
- Africa
- Adriatics Region
- Eastern Africa
- Israel
- Nordics
- Middle East and Africa
- Balkans
- Italy
- Bulgaria
- Cyprus
- APAC
Quantum SD-WAN Monitoring
Watch NowCheckMates Fest 2026
Watch Now!AI Security Masters
Hacking with AI: The Dark Side of Innovation
MVP 2026: Submissions
Are Now Open!
Overlap in Security Validation
Help us to understand your needs better
CheckMates Go:
R82.10 and Rationalizing Multi Vendor Security Policies
Turn on suggestions
Auto-suggest helps you quickly narrow down your search results by suggesting possible matches as you type.
Showing results for
- CheckMates
- :
- Products
- :
- Network & SASE
- :
- Management
- :
- Re: Bandwidth Monitoring of Specific Interface?
Options
- Subscribe to RSS Feed
- Mark Topic as New
- Mark Topic as Read
- Float this Topic for Current User
- Bookmark
- Subscribe
- Mute
- Printer Friendly Page
Turn on suggestions
Auto-suggest helps you quickly narrow down your search results by suggesting possible matches as you type.
Showing results for
Are you a member of CheckMates?
×
Sign in with your Check Point UserCenter/PartnerMap account to access more great content and get a chance to win some Apple AirPods! If you don't have an account, create one now for free!
- Mark as New
- Bookmark
- Subscribe
- Mute
- Subscribe to RSS Feed
- Permalink
- Report Inappropriate Content
Bandwidth Monitoring of Specific Interface?
Is there a view where I can monitor the throughput traffic/bandwidth of an interface in real time, as well as over a defined period? I'm coming from the SonicWALL world and was looking to see if there is similar functionality. Also, is there a way to pull a report that has the bandwidth usage for a specific interface for a specific time period? Thanks for looking.
13 Replies
- Mark as New
- Bookmark
- Subscribe
- Mute
- Subscribe to RSS Feed
- Permalink
- Report Inappropriate Content
You can create a report for this in SmartView Monitor.
In R77.30 and earlier, there is an icon to launch the SmartView Monitor GUI installed with SmartDashboard, etc.
In R80+:
- Open SmartConsole > Logs & Monitor.
- Open the catalog (new tab).
- Click Tunnel & User Monitoring.
See also: Logging and Monitoring R80.10 (Part of Check Point Infinity)
- Mark as New
- Bookmark
- Subscribe
- Mute
- Subscribe to RSS Feed
- Permalink
- Report Inappropriate Content
Appreciate the quick reply Dameon! That is exactly what I was looking for. I will have to mess around with some of the settings here, but I believe I'll be able to create the view I need.
- Mark as New
- Bookmark
- Subscribe
- Mute
- Subscribe to RSS Feed
- Permalink
- Report Inappropriate Content
Hi @PhoneBoy , thanks for this. Sorry to revive this old thread, and I will start one if needed. This is related with the OP questions though and with SmartView Monitor.
Is it possible to still search by "History" and still have it provide "Interfaces" as an option? What I am trying to do is get a 30 day report of how much Mbps is going through Eth1.
My other option so far is looking at DiagnosticsViewer, but that is going to be a different thread.
Thank you!
- Mark as New
- Bookmark
- Subscribe
- Mute
- Subscribe to RSS Feed
- Permalink
- Report Inappropriate Content
Seems like it should be possible.
That said, you might want to start that separate thread about DiagnosticsViewer.
- Mark as New
- Bookmark
- Subscribe
- Mute
- Subscribe to RSS Feed
- Permalink
- Report Inappropriate Content
There is a very nice command name:
cpmonitor - it will show you in pick time useful information like top sources, ports, packets rates, destination, services and more. It's a build in command so you basically need to run it.
Example:
Suppose you want to monitor eth1:
First
tcpdump -nni eth1 -w ~admin/eth1snif
Let it run for a 30 seconds , then stop the tcpdump and make sure file was created. ( only see it created, you won't see the content as its tcpdump output and can be seen in wireshark or cpmonitor)
Note - you can change the tcpdump output to monitor all interface with the flag "any" but be carful with that.
Lastly, run:
cpmonitor ~admin/eth1snif
You will find there useful information regarding possible outage ....
Good luck and good decision for migrating SonicWall 🙂
- Mark as New
- Bookmark
- Subscribe
- Mute
- Subscribe to RSS Feed
- Permalink
- Report Inappropriate Content
Thank you Daniel. Now this is very interesting... I will try this method as well. Would it be advisable to run tcpdump for an extended period of time? Say 8 hours? I'm really interested in reporting on specific dates and times. If there is anyway this could be scheduled, that would be a plus.
- Mark as New
- Bookmark
- Subscribe
- Mute
- Subscribe to RSS Feed
- Permalink
- Report Inappropriate Content
Hey Nick,
I wouldn't use tcpdump for such amount of time as it can be nasty especially when you run it in flag "any".
Instead, I would use another extremely useful CP tool name:
cpview
first learn how to use it, it straight forward and then use it with the "-t" option to see history activity.
so for example if you would like to see today activity at 06:00 , you will use :
cpview -t 06:00
then, go to network - under that, you can see info like Traffic, Interfaces, Top procols and Top Connections.
The same thing you can find history lets say for the day before:

and to sample each minute, use the "+" and "-" key
good luck
- Mark as New
- Bookmark
- Subscribe
- Mute
- Subscribe to RSS Feed
- Permalink
- Report Inappropriate Content
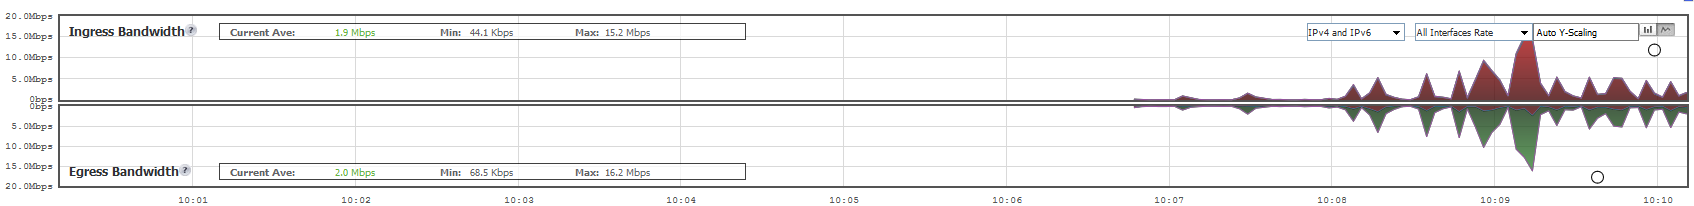
Here is a screenshot of the cpview screen Daniel is talking about, very handy both in real-time and historical. Was using it just this week...

--
My book "Max Power: Check Point Firewall Performance Optimization"
now available via http://maxpowerfirewalls.com.
Gaia 4.18 (R82) Immersion Tips, Tricks, & Best Practices Video Course
Now Available at https://shadowpeak.com/gaia4-18-immersion-course
Now Available at https://shadowpeak.com/gaia4-18-immersion-course
- Mark as New
- Bookmark
- Subscribe
- Mute
- Subscribe to RSS Feed
- Permalink
- Report Inappropriate Content
How do you use to view top connections for a particular time period using cpview.I do find real time data for top connections . Any idea how to get the historical data w.r.t top connections .
Also any way to find out if any blades are causing the spike
- Mark as New
- Bookmark
- Subscribe
- Mute
- Subscribe to RSS Feed
- Permalink
- Report Inappropriate Content
Is it possible to monitor bandwidth usage against a application control rule that uses a bandwidth limit object? The idea is to then determine if it's actually working and confirm the consumption of the limit, ideally this should be viewed in graph format so we can see real-time and historic information easily.
The most I can see is just the hit counts.
We are running R80.30 with JHFA 155
- Mark as New
- Bookmark
- Subscribe
- Mute
- Subscribe to RSS Feed
- Permalink
- Report Inappropriate Content
What a great feature, thanks for sharing. It works great in R80.10 (but in R77.30 it errors with missing shared libraries).
- Mark as New
- Bookmark
- Subscribe
- Mute
- Subscribe to RSS Feed
- Permalink
- Report Inappropriate Content
Hey Nick,
Here is more options to obtain some of the insight you're looking for with historical data.
Using the documentation: Logging and Monitoring R80.10 (Part of Check Point Infinity)
Read up more in the "traffic or system counters solution" section
To run a Traffic or System Counters view:
- In the SmartView Monitor client, select the Traffic or System Counter branch in the Tree View.
- Double-click the Traffic or System Counter view that you want to run.
A list of available gateways shows.
- Select the gateway for which you want to run the selected Traffic or System Counter view.
- Click OK.
The results of the selected view show in the SmartView Monitor client.
Recording a Traffic or Counter View
You can save a record of the Traffic or System Counter view results.
To record a traffic or counter view:
- Run the Traffic or System Counters view.
- Select the Traffic menu.
- Select Recording > Record.
A Save As window shows.
- Name the record.
- Save it in the related directory.
- Click Save.
The word Recording shows below the Traffic or Counter toolbar. The appearance of this word signifies that the view currently running is recorded and saved.
- To stop recording, open the Traffic menu and select Recording > Stop.
A record of the view results is saved in the directory you selected in step 3 above.
Play the Results of a Recorded Traffic or Counter View
After you record a view, you can play it back. You can select Play or Fast Play, to see results change faster.
To play the results:
- In the SmartView Monitor client, select Traffic > Recording > Play.
The Select Recorded File window shows.
- Access the directory in which the recorded file is kept and select the related record.
- Click Open.
The results of the selected recorded view start to run. The word Playing shows below the toolbar.
Pause or Stop the Results of a Recorded View that is Playing
- To pause the record select Traffic > Recording > Pause.
- Click Recording > Play to resume to play the Traffic or Counter view results recorded before.
- To stop the record select Traffic > Recording > Stop.
Pg 96
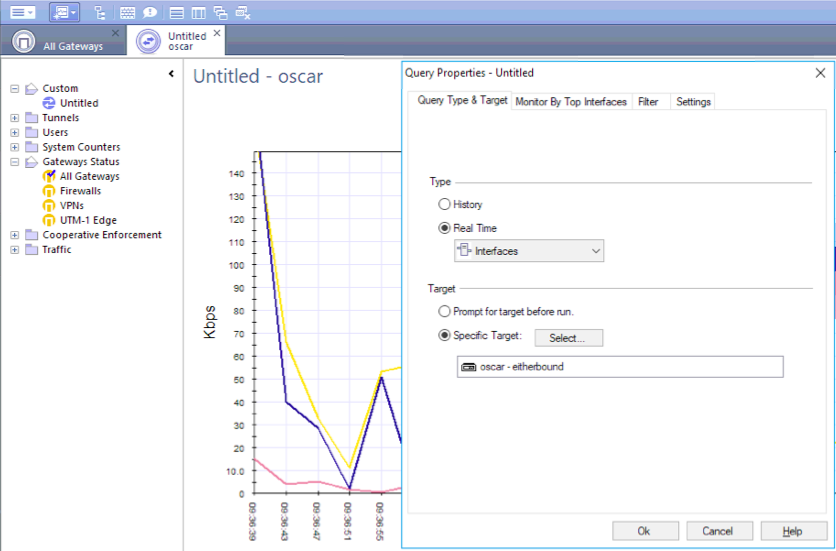
To creating a custom traffic view:
- In the Tree, right-click Custom and select New Traffic View.
The Query Properties window opens.
- Select History or Real Time.
- If you select Real Time, select what you want to see:
- Interfaces
- Services
- IPs / Network Objects
- QoS Rules
- Security Rules
- Connections
- Tunnels
- Virtual Links
- Packet Size Distribution
- Select the Target gateway.
- If you often need results for on gateway, select it in Specific Gateway.
- If you have a small number of gateways, you can create a custom view for each one.
- If not, select Prompt for Gateway before run.
- Open the next tabs.
The tabs that show depend on the Query Type you selected.
- If you select History, the next tab is Traffic History, where you select the Time Frame and type of report.
- If you select Real Time, the next tabs let you set services or objects to monitor, gateways or specified IP addresses to monitor, update interval, result type, and chart settings.
- Click Save.
- Right-click the new Custom view and select Rename.
- Enter a name for the view.
- Mark as New
- Bookmark
- Subscribe
- Mute
- Subscribe to RSS Feed
- Permalink
- Report Inappropriate Content
What other options are available if Monitoring blade is not enabled (license) now that is not possible like in 77.30 vsx to check the top connection with their bandwidth usage ?
Leaderboard
Epsum factorial non deposit quid pro quo hic escorol.
| User | Count |
|---|---|
| 20 | |
| 13 | |
| 9 | |
| 7 | |
| 6 | |
| 6 | |
| 4 | |
| 4 | |
| 3 | |
| 3 |
Upcoming Events
Tue 27 Jan 2026 @ 11:00 AM (EST)
CloudGuard Network Security for Red Hat OpenShift VirtualizationThu 12 Feb 2026 @ 05:00 PM (CET)
AI Security Masters Session 3: Exposing AI Vulnerabilities: CP<R> Latest Security FindingsFri 13 Feb 2026 @ 10:00 AM (CET)
CheckMates Live Netherlands - Sessie 43: Terugblik op de Check Point Sales Kick Off 2026Thu 26 Feb 2026 @ 05:00 PM (CET)
AI Security Masters Session 4: Powering Prevention: The AI Driving Check Point’s ThreatCloudTue 27 Jan 2026 @ 11:00 AM (EST)
CloudGuard Network Security for Red Hat OpenShift VirtualizationFri 13 Feb 2026 @ 10:00 AM (CET)
CheckMates Live Netherlands - Sessie 43: Terugblik op de Check Point Sales Kick Off 2026Thu 26 Feb 2026 @ 05:00 PM (CET)
AI Security Masters Session 4: Powering Prevention: The AI Driving Check Point’s ThreatCloudAbout CheckMates
Learn Check Point
Advanced Learning
YOU DESERVE THE BEST SECURITY
©1994-2026 Check Point Software Technologies Ltd. All rights reserved.
Copyright
Privacy Policy
About Us
UserCenter