- Products
- Learn
- Local User Groups
- Partners
- More
This website uses Cookies. Click Accept to agree to our website's cookie use as described in our Privacy Policy. Click Preferences to customize your cookie settings.
- Products
- Learn
- Local User Groups
- Upcoming Events
- Americas
- EMEA
- Czech Republic and Slovakia
- Denmark
- Netherlands
- Germany
- Sweden
- United Kingdom and Ireland
- France
- Spain
- Norway
- Ukraine
- Baltics and Finland
- Greece
- Portugal
- Austria
- Kazakhstan and CIS
- Switzerland
- Romania
- Turkey
- Belarus
- Belgium & Luxembourg
- Russia
- Poland
- Georgia
- DACH - Germany, Austria and Switzerland
- Iberia
- Africa
- Adriatics Region
- Eastern Africa
- Israel
- Nordics
- Middle East and Africa
- Balkans
- Italy
- Bulgaria
- Cyprus
- APAC
- Partners
- More
- ABOUT CHECKMATES & FAQ
- Sign In
- Leaderboard
- Events
Step Into the Future of
AI-Powered Cyber Security
The State of Ransomware Q1 2026
Key Trends and Their Impact
AI Security Masters E8:
Claude Mythos: New Era in Cyber Security
Blueprint Architecture for Securing
The AI Factory & AI Data Center
Call For Papers
Your Expertise. Our Stage
CheckMates Go:
CheckMates Fest
Turn on suggestions
Auto-suggest helps you quickly narrow down your search results by suggesting possible matches as you type.
Showing results for
- CheckMates
- :
- Products
- :
- General Topics
- :
- Re: cpview -t top connections
Options
- Subscribe to RSS Feed
- Mark Topic as New
- Mark Topic as Read
- Float this Topic for Current User
- Bookmark
- Subscribe
- Mute
- Printer Friendly Page
Turn on suggestions
Auto-suggest helps you quickly narrow down your search results by suggesting possible matches as you type.
Showing results for
Are you a member of CheckMates?
×
Sign in with your Check Point UserCenter/PartnerMap account to access more great content and get a chance to win some Apple AirPods! If you don't have an account, create one now for free!
- Mark as New
- Bookmark
- Subscribe
- Mute
- Subscribe to RSS Feed
- Permalink
- Report Inappropriate Content
Jump to solution
cpview -t top connections
Hello,
How I can see top connections that consumed CPUs, but not in real-time, but in history, like with 'cpview -t' or similar?
Best Regards,
Igor
2 Solutions
Accepted Solutions
- Mark as New
- Bookmark
- Subscribe
- Mute
- Subscribe to RSS Feed
- Permalink
- Report Inappropriate Content
First off, in real-time (not history mode) the "Top Connections" by Network/CPU screens of cpview will not be populated by default unless you enable them as specified in the following SK, can you currently see Top Connections in real time? sk167903: CPview Top Connections and Protocols tabs show no data If you can't see them in real time they won't be recorded for history mode.
Another related historical method you would be able to use is running fw ctl multik print_heavy_conn which will show you all identified elephant flows over the last 24 hours.
Also be aware there is a relatively new tool called top_conns that can also show top connections by CPU usage in real-time: sk172229: Top Connections Tool
New Book: "Max Power 2026" Coming Soon
Check Point Firewall Performance Optimization
Check Point Firewall Performance Optimization
- Mark as New
- Bookmark
- Subscribe
- Mute
- Subscribe to RSS Feed
- Permalink
- Report Inappropriate Content
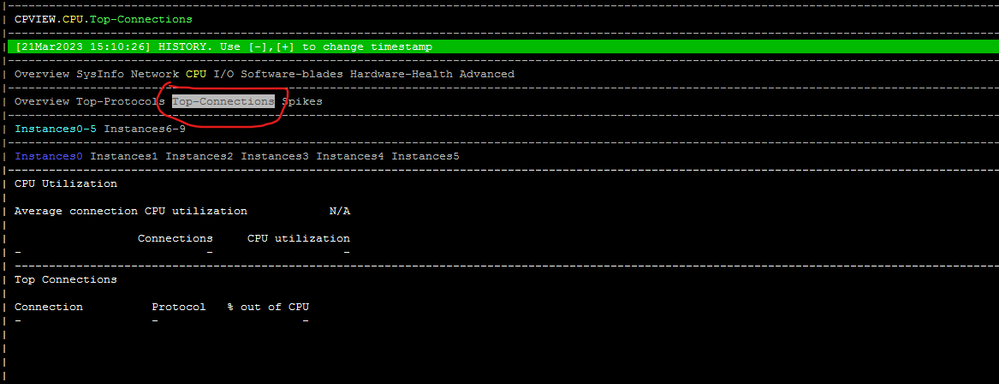
"CPU -> Top connections" is not available in cpview history.
@the_rock, are you sure that you are seeing data under "CPU -> Top connections" (and not just the headlines)?
13 Replies
- Mark as New
- Bookmark
- Subscribe
- Mute
- Subscribe to RSS Feed
- Permalink
- Report Inappropriate Content
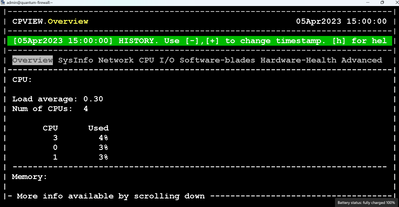
You can do cpview -t and then hit letter t again and it will ask you to input time frame, example apr 5 2023 15:00:00...then you just keep hitting + to see the history. Not sure how far it can go back, but R&D told me last year thats automatically calculated, so you can try different dates.
Andy
Best,
Andy
"Have a great day and if its not, change it"
Andy
"Have a great day and if its not, change it"
- Mark as New
- Bookmark
- Subscribe
- Mute
- Subscribe to RSS Feed
- Permalink
- Report Inappropriate Content
Thanks, but I already know that 🙂 What I would like to achieve is to get "Top Connections" view in history mode, but as you can see Top-Connections is empty in 'cpview -t'.
- Mark as New
- Bookmark
- Subscribe
- Mute
- Subscribe to RSS Feed
- Permalink
- Report Inappropriate Content
First off, in real-time (not history mode) the "Top Connections" by Network/CPU screens of cpview will not be populated by default unless you enable them as specified in the following SK, can you currently see Top Connections in real time? sk167903: CPview Top Connections and Protocols tabs show no data If you can't see them in real time they won't be recorded for history mode.
Another related historical method you would be able to use is running fw ctl multik print_heavy_conn which will show you all identified elephant flows over the last 24 hours.
Also be aware there is a relatively new tool called top_conns that can also show top connections by CPU usage in real-time: sk172229: Top Connections Tool
New Book: "Max Power 2026" Coming Soon
Check Point Firewall Performance Optimization
Check Point Firewall Performance Optimization
- Mark as New
- Bookmark
- Subscribe
- Mute
- Subscribe to RSS Feed
- Permalink
- Report Inappropriate Content
Thank you on your reply...
Top-connections in real time cpview are already enabled (by default) since my gateways are on R81.10 and I can see them, but there is no top-connections in history (cpview -t). So, I'm not sure if this is expected behavior?
Regards,
Igor
- Mark as New
- Bookmark
- Subscribe
- Mute
- Subscribe to RSS Feed
- Permalink
- Report Inappropriate Content
Hmm I can't recall if the cpview Top Connections by CPU or Bandwidth data is available in the cpview history database. My guess would be no, but let me tag the owner of cpview @Arik_Ovtracht for a clarification.
New Book: "Max Power 2026" Coming Soon
Check Point Firewall Performance Optimization
Check Point Firewall Performance Optimization
- Mark as New
- Bookmark
- Subscribe
- Mute
- Subscribe to RSS Feed
- Permalink
- Report Inappropriate Content
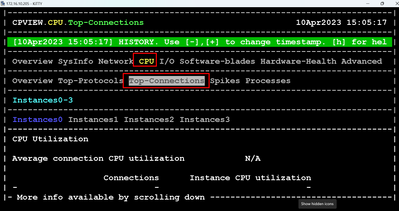
Appears it is there.
Andy
Best,
Andy
"Have a great day and if its not, change it"
Andy
"Have a great day and if its not, change it"
- Mark as New
- Bookmark
- Subscribe
- Mute
- Subscribe to RSS Feed
- Permalink
- Report Inappropriate Content
Yes but is there any data actually on that screen in history mode? Also what code and Jumbo level is that?
New Book: "Max Power 2026" Coming Soon
Check Point Firewall Performance Optimization
Check Point Firewall Performance Optimization
- Mark as New
- Bookmark
- Subscribe
- Mute
- Subscribe to RSS Feed
- Permalink
- Report Inappropriate Content
There is data, even in R81.10 jumbo 94. One I tested is R81.20 jumbo 8.
Andy
Best,
Andy
"Have a great day and if its not, change it"
Andy
"Have a great day and if its not, change it"
- Mark as New
- Bookmark
- Subscribe
- Mute
- Subscribe to RSS Feed
- Permalink
- Report Inappropriate Content
Hm...I checked with another customer (R81.10 Jumbo 30) and there is also no any data from Top-Connections tab in cpview -t. The one that I reported the problem initially is currently on R81.10 Jumbo 81 (also without data)... Maybe I will update to Jumbo 94 as you confirmed that you see the data with this r81.10 Jumbo.
- Mark as New
- Bookmark
- Subscribe
- Mute
- Subscribe to RSS Feed
- Permalink
- Report Inappropriate Content
You may wish to confirm with TAC, but I definitely see it working in my lab.
Best,
Andy
"Have a great day and if its not, change it"
Andy
"Have a great day and if its not, change it"
- Mark as New
- Bookmark
- Subscribe
- Mute
- Subscribe to RSS Feed
- Permalink
- Report Inappropriate Content
"CPU -> Top connections" is not available in cpview history.
@the_rock, are you sure that you are seeing data under "CPU -> Top connections" (and not just the headlines)?
- Mark as New
- Bookmark
- Subscribe
- Mute
- Subscribe to RSS Feed
- Permalink
- Report Inappropriate Content
Im pretty sure, will double check when I get home.
Best,
Andy
"Have a great day and if its not, change it"
Andy
"Have a great day and if its not, change it"
- Mark as New
- Bookmark
- Subscribe
- Mute
- Subscribe to RSS Feed
- Permalink
- Report Inappropriate Content
Yup, apologies, it was just the headlines, I did not examine it properly beforehand, my bad.
Andy
Best,
Andy
"Have a great day and if its not, change it"
Andy
"Have a great day and if its not, change it"
Leaderboard
Epsum factorial non deposit quid pro quo hic escorol.
| User | Count |
|---|---|
| 5 | |
| 4 | |
| 4 | |
| 3 | |
| 3 | |
| 3 | |
| 3 | |
| 3 | |
| 2 | |
| 2 |
Upcoming Events
Tue 12 May 2026 @ 10:00 AM (CEST)
The Cloud Architects Series: Check Point Cloud Firewall delivered as a serviceWed 13 May 2026 @ 11:00 AM (EDT)
TechTalk: The State of Ransomware Q1 2026: Key Trends and Their ImpactThu 14 May 2026 @ 07:00 PM (EEST)
Under the Hood: Presentando Check Point Cloud Firewall como ServicioTue 12 May 2026 @ 10:00 AM (CEST)
The Cloud Architects Series: Check Point Cloud Firewall delivered as a serviceAbout CheckMates
Learn Check Point
Advanced Learning
YOU DESERVE THE BEST SECURITY
©1994-2026 Check Point Software Technologies Ltd. All rights reserved.
Copyright
Privacy Policy
About Us
UserCenter


