- Products
Quantum
Secure the Network IoT Protect Maestro Management OpenTelemetry/Skyline Remote Access VPN SD-WAN Security Gateways SmartMove Smart-1 Cloud SMB Gateways (Spark) Threat PreventionCloudGuard CloudMates
Secure the Cloud CNAPP Cloud Network Security CloudGuard - WAF CloudMates General Talking Cloud Podcast Weekly Reports - Learn
- Local User Groups
- Partners
- More

This website uses Cookies. Click Accept to agree to our website's cookie use as described in our Privacy Policy. Click Preferences to customize your cookie settings.
- Products
- Learn
- Local User Groups
- Upcoming Events
- Americas
- EMEA
- Czech Republic and Slovakia
- Denmark
- Netherlands
- Germany
- Sweden
- United Kingdom and Ireland
- France
- Spain
- Norway
- Ukraine
- Baltics and Finland
- Greece
- Portugal
- Austria
- Kazakhstan and CIS
- Switzerland
- Romania
- Turkey
- Belarus
- Belgium & Luxembourg
- Russia
- Poland
- Georgia
- DACH - Germany, Austria and Switzerland
- Iberia
- Africa
- Adriatics Region
- Eastern Africa
- Israel
- Nordics
- Middle East and Africa
- Balkans
- Italy
- Bulgaria
- APAC
- Partners
- More
- ABOUT CHECKMATES & FAQ
- Sign In
- Leaderboard
- Events
CheckMates Fest 2025!
Join the Biggest Event of the Year!
Simplifying Zero Trust Security
with Infinity Identity!
Operational Health Monitoring
Help us with the Short-Term Roadmap
CheckMates Go:
Recently on CheckMates
Turn on suggestions
Auto-suggest helps you quickly narrow down your search results by suggesting possible matches as you type.
Showing results for
- CheckMates
- :
- Products
- :
- Quantum
- :
- Threat Prevention
- :
- R81.10 Resuming IPS inspection which was bypassed ...
Options
- Subscribe to RSS Feed
- Mark Topic as New
- Mark Topic as Read
- Float this Topic for Current User
- Bookmark
- Subscribe
- Mute
- Printer Friendly Page
Turn on suggestions
Auto-suggest helps you quickly narrow down your search results by suggesting possible matches as you type.
Showing results for
Are you a member of CheckMates?
×
Sign in with your Check Point UserCenter/PartnerMap account to access more great content and get a chance to win some Apple AirPods! If you don't have an account, create one now for free!
- Mark as New
- Bookmark
- Subscribe
- Mute
- Subscribe to RSS Feed
- Permalink
- Report Inappropriate Content
Jump to solution
R81.10 Resuming IPS inspection which was bypassed due to resources shortage at MUP:0 CUP:0
I have a R81.10 16200 cluster "at this moment" migrated from older cluster (R77.30)
I see in the logs:
Attack Information: IPS Bypass Disengaged
Attack Name: IPS Bypass
Resource Shortage: Resuming IPS inspection which was bypassed due to resources shortage - CPU utilization / Memory utilization are:
Memory Utilization Percent:0
CPU Utilization Percent: 0
My GW CPU usage is around 10%. I see sk172305 and this message is likely a fake or real message? It means I should disable ips bypass or ignore this message? Or open a case to fix it ...
1 Solution
Accepted Solutions
- Mark as New
- Bookmark
- Subscribe
- Mute
- Subscribe to RSS Feed
- Permalink
- Report Inappropriate Content
As Val said you need to track down the source of the spike, probably an elephant flow which you can check with fw ctl multik print_heavy_conn.
When it comes to the IPS Bypass feature JUST SAY NO. I've been ripping on this feature for years in my books and classes, here is the latest iteration in my 2021 IPS/AV/ABOT video series:

Attend my 60-minute "Be your Own TAC: Part Deux" Presentation
Exclusively at CPX 2025 Las Vegas Tuesday Feb 25th @ 1:00pm
Exclusively at CPX 2025 Las Vegas Tuesday Feb 25th @ 1:00pm
17 Replies
- Mark as New
- Bookmark
- Subscribe
- Mute
- Subscribe to RSS Feed
- Permalink
- Report Inappropriate Content
Depending on actual amount of cores, 10% average utilization may mean 100% on one or several cores, while others are idle. That will trigger IPS bypass nonetheless.
Look into "cpview" history or check on "top", to see actual per core utilisation.
- Mark as New
- Bookmark
- Subscribe
- Mute
- Subscribe to RSS Feed
- Permalink
- Report Inappropriate Content
- Mark as New
- Bookmark
- Subscribe
- Mute
- Subscribe to RSS Feed
- Permalink
- Report Inappropriate Content
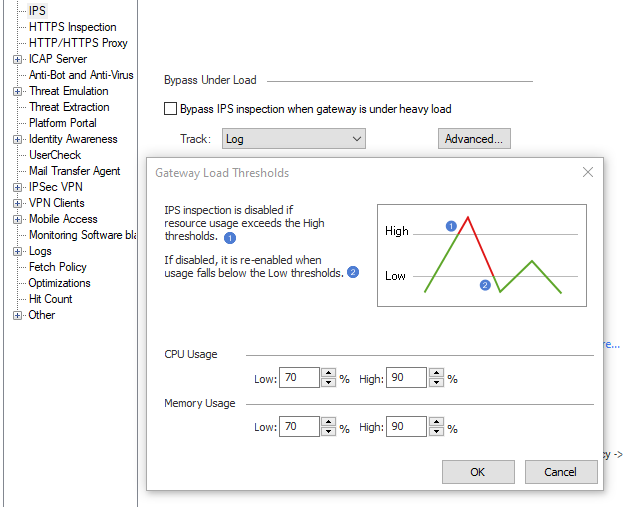
ips bypass stat
IPS Bypass Under Load: Enabled
Currently under load: No
Currently in bypass: No
CPU Usage thresholds: Low: 70, High: 90
Memory Usage thresholds: Low: 70, High: 90
- Mark as New
- Bookmark
- Subscribe
- Mute
- Subscribe to RSS Feed
- Permalink
- Report Inappropriate Content
This is only the current state. Look at the timestamps in the logs, start historical view of cpview and go about that mentioned time to see CPU situation.
- Mark as New
- Bookmark
- Subscribe
- Mute
- Subscribe to RSS Feed
- Permalink
- Report Inappropriate Content
Yes, sometimes. General I have a equal load on cores, but cores have changing in time load.
top - 10:15:28 up 1 day, 16:34, 2 users, load average: 8.01, 8.40, 7.96
Tasks: 957 total, 1 running, 956 sleeping, 0 stopped, 0 zombie
%Cpu0 : 0.0 us, 20.6 sy, 0.0 ni, 52.0 id, 0.0 wa, 2.9 hi, 24.5 si, 0.0 st
%Cpu1 : 0.0 us, 1.0 sy, 0.0 ni, 74.5 id, 0.0 wa, 2.9 hi, 21.6 si, 0.0 st
%Cpu2 : 8.7 us, 5.8 sy, 0.0 ni, 85.4 id, 0.0 wa, 0.0 hi, 0.0 si, 0.0 st
%Cpu3 : 9.6 us, 6.7 sy, 0.0 ni, 82.7 id, 0.0 wa, 1.0 hi, 0.0 si, 0.0 st
%Cpu4 : 12.9 us, 8.9 sy, 0.0 ni, 78.2 id, 0.0 wa, 0.0 hi, 0.0 si, 0.0 st
%Cpu5 : 15.5 us, 8.7 sy, 0.0 ni, 74.8 id, 0.0 wa, 1.0 hi, 0.0 si, 0.0 st
%Cpu6 : 7.9 us, 7.9 sy, 0.0 ni, 83.2 id, 0.0 wa, 1.0 hi, 0.0 si, 0.0 st
%Cpu7 : 0.0 us, 0.0 sy, 0.0 ni, 87.1 id, 0.0 wa, 1.0 hi, 11.9 si, 0.0 st
%Cpu8 : 9.6 us, 6.7 sy, 0.0 ni, 83.7 id, 0.0 wa, 0.0 hi, 0.0 si, 0.0 st
%Cpu9 : 8.8 us, 8.8 sy, 0.0 ni, 82.4 id, 0.0 wa, 0.0 hi, 0.0 si, 0.0 st
%Cpu10 : 11.7 us, 11.7 sy, 0.0 ni, 75.7 id, 0.0 wa, 1.0 hi, 0.0 si, 0.0 st
%Cpu11 : 6.9 us, 6.9 sy, 0.0 ni, 86.3 id, 0.0 wa, 0.0 hi, 0.0 si, 0.0 st
%Cpu12 : 8.7 us, 7.7 sy, 0.0 ni, 82.7 id, 0.0 wa, 1.0 hi, 0.0 si, 0.0 st
%Cpu13 : 0.0 us, 1.0 sy, 0.0 ni, 65.7 id, 0.0 wa, 2.9 hi, 30.4 si, 0.0 st
%Cpu14 : 8.7 us, 8.7 sy, 0.0 ni, 80.8 id, 0.0 wa, 1.0 hi, 1.0 si, 0.0 st
%Cpu15 : 0.0 us, 0.0 sy, 0.0 ni, 78.0 id, 0.0 wa, 2.0 hi, 20.0 si, 0.0 st
%Cpu16 : 9.0 us, 8.0 sy, 0.0 ni, 83.0 id, 0.0 wa, 0.0 hi, 0.0 si, 0.0 st
%Cpu17 : 10.6 us, 9.6 sy, 0.0 ni, 78.8 id, 0.0 wa, 0.0 hi, 1.0 si, 0.0 st
%Cpu18 : 18.1 us, 12.4 sy, 0.0 ni, 69.5 id, 0.0 wa, 0.0 hi, 0.0 si, 0.0 st
%Cpu19 : 7.8 us, 8.7 sy, 0.0 ni, 83.5 id, 0.0 wa, 0.0 hi, 0.0 si, 0.0 st
%Cpu20 : 8.7 us, 7.8 sy, 0.0 ni, 83.5 id, 0.0 wa, 0.0 hi, 0.0 si, 0.0 st
%Cpu21 : 12.0 us, 7.0 sy, 0.0 ni, 81.0 id, 0.0 wa, 0.0 hi, 0.0 si, 0.0 st
%Cpu22 : 10.9 us, 9.9 sy, 0.0 ni, 79.2 id, 0.0 wa, 0.0 hi, 0.0 si, 0.0 st
%Cpu23 : 7.0 us, 11.0 sy, 0.0 ni, 82.0 id, 0.0 wa, 0.0 hi, 0.0 si, 0.0 st
%Cpu24 : 0.0 us, 0.0 sy, 0.0 ni, 82.0 id, 0.0 wa, 2.0 hi, 16.0 si, 0.0 st
%Cpu25 : 0.0 us, 1.0 sy, 0.0 ni, 79.2 id, 0.0 wa, 2.0 hi, 17.8 si, 0.0 st
%Cpu26 : 8.7 us, 4.9 sy, 0.0 ni, 86.4 id, 0.0 wa, 0.0 hi, 0.0 si, 0.0 st
%Cpu27 : 7.0 us, 8.0 sy, 0.0 ni, 85.0 id, 0.0 wa, 0.0 hi, 0.0 si, 0.0 st
%Cpu28 : 5.0 us, 5.9 sy, 0.0 ni, 89.1 id, 0.0 wa, 0.0 hi, 0.0 si, 0.0 st
%Cpu29 : 12.6 us, 7.8 sy, 0.0 ni, 79.6 id, 0.0 wa, 0.0 hi, 0.0 si, 0.0 st
%Cpu30 : 7.8 us, 6.9 sy, 0.0 ni, 85.3 id, 0.0 wa, 0.0 hi, 0.0 si, 0.0 st
%Cpu31 : 1.0 us, 1.0 sy, 0.0 ni, 85.6 id, 0.0 wa, 1.9 hi, 10.6 si, 0.0 st
%Cpu32 : 8.7 us, 6.8 sy, 0.0 ni, 84.5 id, 0.0 wa, 0.0 hi, 0.0 si, 0.0 st
%Cpu33 : 5.9 us, 4.0 sy, 0.0 ni, 89.1 id, 0.0 wa, 1.0 hi, 0.0 si, 0.0 st
%Cpu34 : 11.0 us, 9.0 sy, 0.0 ni, 80.0 id, 0.0 wa, 0.0 hi, 0.0 si, 0.0 st
%Cpu35 : 5.9 us, 5.0 sy, 0.0 ni, 89.1 id, 0.0 wa, 0.0 hi, 0.0 si, 0.0 st
%Cpu36 : 12.6 us, 5.8 sy, 0.0 ni, 80.6 id, 0.0 wa, 1.0 hi, 0.0 si, 0.0 st
%Cpu37 : 0.0 us, 1.0 sy, 0.0 ni, 83.3 id, 0.0 wa, 2.0 hi, 13.7 si, 0.0 st
%Cpu38 : 25.7 us, 10.9 sy, 0.0 ni, 62.4 id, 0.0 wa, 1.0 hi, 0.0 si, 0.0 st
%Cpu39 : 1.0 us, 1.0 sy, 0.0 ni, 75.7 id, 0.0 wa, 3.9 hi, 18.4 si, 0.0 st
%Cpu40 : 10.8 us, 5.9 sy, 0.0 ni, 83.3 id, 0.0 wa, 0.0 hi, 0.0 si, 0.0 st
%Cpu41 : 9.9 us, 16.8 sy, 0.0 ni, 73.3 id, 0.0 wa, 0.0 hi, 0.0 si, 0.0 st
%Cpu42 : 11.5 us, 10.6 sy, 0.0 ni, 76.9 id, 0.0 wa, 1.0 hi, 0.0 si, 0.0 st
%Cpu43 : 7.0 us, 7.0 sy, 0.0 ni, 86.0 id, 0.0 wa, 0.0 hi, 0.0 si, 0.0 st
%Cpu44 : 12.6 us, 7.8 sy, 0.0 ni, 79.6 id, 0.0 wa, 0.0 hi, 0.0 si, 0.0 st
%Cpu45 : 7.9 us, 6.9 sy, 0.0 ni, 85.1 id, 0.0 wa, 0.0 hi, 0.0 si, 0.0 st
%Cpu46 : 30.1 us, 19.4 sy, 0.0 ni, 50.5 id, 0.0 wa, 0.0 hi, 0.0 si, 0.0 st
%Cpu47 : 1.0 us, 1.0 sy, 0.0 ni, 98.0 id, 0.0 wa, 0.0 hi, 0.0 si, 0.0 st
...
[11Jan2022 12:25:15] HISTORY. Use [-],[+] to change timestamp |
|-------------------------------------------------------------------------------------------------------------------------------------------------------------------------------------------------------------------------|
| Overview SysInfo Network CPU I/O Software-blades Hardware-Health Advanced |
|-------------------------------------------------------------------------------------------------------------------------------------------------------------------------------------------------------------------------|
| Overview Top-Protocols Top-Connections Spikes |
|-------------------------------------------------------------------------------------------------------------------------------------------------------------------------------------------------------------------------|
| Host |
|-------------------------------------------------------------------------------------------------------------------------------------------------------------------------------------------------------------------------|
| Overview: |
| |
| CPU type CPUs Avg utilization |
| - - - |
| ----------------------------------------------------------------------------------------------------------------------------------------------------------------------------------------------------------------------- |
| CPU: |
| |
| CPU Type User System Idle I/O wait Interrupts |
| 0 CoreXL_SND 0% 0% 100% 0% 2,715 |
| 1 CoreXL_SND 0% 0% 100% 0% 2,685 |
| 2 CoreXL_FW 0% 0% 100% 0% 2,684 |
| 3 CoreXL_FW 0% 0% 100% 0% 2,673 |
| 4 CoreXL_FW 0% 0% 100% 0% 2,658 |
| 5 CoreXL_FW 0% 0% 100% 0% 2,603 |
| 6 CoreXL_FW 0% 0% 100% 0% 2,588 |
| 7 CoreXL_FW 0% 9% 91% 0% 2,497 |
| 8 CoreXL_FW 0% 0% 100% 0% 2,457 |
| 9 CoreXL_FW 0% 0% 100% 0% 2,399 |
| 10 CoreXL_FW 0% 0% 100% 0% 2,391 |
| 11 CoreXL_FW 0% 0% 100% 0% 2,425 |
| 12 BOTH 9% 0% 91% 0% 2,371 |
| 13 BOTH 0% 0% 100% 0% 2,408 |
| 14 CoreXL_FW 9% 0% 91% 0% 2,407 |
| 15 CoreXL_FW 0% 0% 100% 0% 2,451 |
| 16 CoreXL_FW 0% 0% 100% 0% 2,466 |
| 17 CoreXL_FW 0% 0% 100% 0% 2,447 |
| 18 CoreXL_FW 0% 100% 0% 0% 2,425 |
| 19 CoreXL_FW 0% 0% 100% 0% 2,452 |
| 20 CoreXL_FW 0% 0% 100% 0% 2,462 |
| 21 CoreXL_FW 0% 0% 100% 0% 2,474 |
| 22 CoreXL_FW 0% 0% 100% 0% 2,456 |
| 23 CoreXL_FW 0% 0% 100% 0% 2,474 |
| 24 CoreXL_SND 0% 0% 100% 0% 2,493 |
| 25 CoreXL_SND 0% 0% 100% 0% 2,465 |
| 26 CoreXL_FW 9% 27% 64% 0% 2,464 |
| 27 CoreXL_FW 0% 9% 91% 0% 2,437 |
| 28 CoreXL_FW 9% 18% 73% 0% 2,396 |
| 29 CoreXL_FW 0% 0% 100% 0% 2,441 |
| 30 CoreXL_FW 0% 0% 100% 0% 2,452 |
|- More info available by scrolling down --------------------------------------------
tail /var/log/messages:
...
Jan 17 10:06:58 2022 fw1 spike_detective: spike info: type: cpu, cpu core: 4, top consumer: fwk0_38, start time: 17/01/22 10:06:09, spike duration (sec): 48, initial cpu usage: 82, average cpu usage: 71, perf taken: 1
Jan 17 10:08:21 2022 fw1 spike_detective: spike info: type: cpu, cpu core: 0, top consumer: system interrupts, start time: 17/01/22 10:03:23, spike duration (sec): 297, initial cpu usage: 92, average cpu usage: 62, perf taken: 1
...
- Mark as New
- Bookmark
- Subscribe
- Mute
- Subscribe to RSS Feed
- Permalink
- Report Inappropriate Content
Exactly that:
| 18 CoreXL_FW 0% 100% 0% 0% 2,425 |
That was the trigger.
- Mark as New
- Bookmark
- Subscribe
- Mute
- Subscribe to RSS Feed
- Permalink
- Report Inappropriate Content
In the /var/log/spike_detective/spike_detective.log I see roughly "a page" of spikes from today. So the conclusion is "disable ips bypass"?
By the way, I have problem with monitoring, but it looks unrelated to the IPS problems.

Based on this picture I have no communication over 16s periods. It looks I have a very, very tolerant users ;-). What may be the cause of such presentation?
- Mark as New
- Bookmark
- Subscribe
- Mute
- Subscribe to RSS Feed
- Permalink
- Report Inappropriate Content
Sorry, I have a hard time to understand what you are trying to say. Where do you see traffic outage? If you
IPS bypass kicks in when one or several CPUs are other threshold, to protect your production traffic and to make sure it still flows even if one of FWKs is very busy.
If you disable IPS bypass mechanism, it will only decrease performance during peak time. The proper way of action here is to get the root cause of the spikes and try to work it around.
- Mark as New
- Bookmark
- Subscribe
- Mute
- Subscribe to RSS Feed
- Permalink
- Report Inappropriate Content
If Accepted Packet Rate == 0 or Bytes Throughput == 0 then No traffic passing (on the screen - gray and blue lines). On the new console traffic flows. Monitored by snmp is OK. On Smart View Monitor - Carcassonne.
Spikes on big files are normal, because of most of the security inspections are single-threaded per single file, I think. And CPU is to work, not to be left idle - specially if you have 60 cores. So TH is right fighting it,but every vendor has it - connectivity over security.
So the final answer is "yes, disable bypass" - ips bypass off - fast fix, disable on cluster - permanent.
- Mark as New
- Bookmark
- Subscribe
- Mute
- Subscribe to RSS Feed
- Permalink
- Report Inappropriate Content
As Val said you need to track down the source of the spike, probably an elephant flow which you can check with fw ctl multik print_heavy_conn.
When it comes to the IPS Bypass feature JUST SAY NO. I've been ripping on this feature for years in my books and classes, here is the latest iteration in my 2021 IPS/AV/ABOT video series:
Attend my 60-minute "Be your Own TAC: Part Deux" Presentation
Exclusively at CPX 2025 Las Vegas Tuesday Feb 25th @ 1:00pm
Exclusively at CPX 2025 Las Vegas Tuesday Feb 25th @ 1:00pm
- Mark as New
- Bookmark
- Subscribe
- Mute
- Subscribe to RSS Feed
- Permalink
- Report Inappropriate Content
Thank you very much for this comprehensive answer!
- Mark as New
- Bookmark
- Subscribe
- Mute
- Subscribe to RSS Feed
- Permalink
- Report Inappropriate Content
I ran into this, and TAC have said that IPS ByPass is actually designed for SMB appliance (which actually makes sense), therefore this feature can be turned off on highend appliances. I suspect any appliance that has more than 8 cores.
What we also used, again a suggestion from TAC:
fw ctl set int ids_tolerance_no_stress <value higher then 10>
When we used this, we noted a visible reduction in bypassed traffic.
- Mark as New
- Bookmark
- Subscribe
- Mute
- Subscribe to RSS Feed
- Permalink
- Report Inappropriate Content
TAC's answer regarding the IPS bypass feature only being used on SMB makes sense in today's world for those specific appliances with a low core count, but lacks the context of the environment in which the IPS blade was first introduced. The R70 IPS feature was derived from an acquisition of Network Flight Recorder (NFR) which was a good thing, as the prior implementation of IPS in R65 and earlier was called SmartDefense, and...well...let's just say it had some "severe issues" which is putting it quite politely.
When the IPS blade along with the bypass feature was introduced in R70, the largest firewall appliances at the time (Power-1 appliances anyone?) had a maximum of 8 cores, but most firewall models out there only had 2 or 4. So if the CPU load of one of the cores on a 2 or 4 core firewall went over the bypass threshold of 90%, that was 50% or 25% of your total processing power getting slammed and severely impacting traffic trying to traverse the firewall. So it is easy to see why the bypass feature might be attractive for this newfangled IPS feature, that was doing far more than just packet header inspection by performing a crapload of "Deep Inspection" via Pattern Matching in the payload of packets.
But in today's SMT-based world of 48 or 72 core firewalls, this bypass feature as currently implemented makes no sense. Gee one of your firewall's 72 cores went over the 90% high threshold limit? That core is a whopping 1.39% of your total firewall processing power, and IPS is going to be automatically disabled/bypassed on the other 67 Firewall Worker Instance Cores (the usual default split, also accounting for fwd's core) just because of that one core getting saturated? Makes no sense...
Attend my 60-minute "Be your Own TAC: Part Deux" Presentation
Exclusively at CPX 2025 Las Vegas Tuesday Feb 25th @ 1:00pm
Exclusively at CPX 2025 Las Vegas Tuesday Feb 25th @ 1:00pm
- Mark as New
- Bookmark
- Subscribe
- Mute
- Subscribe to RSS Feed
- Permalink
- Report Inappropriate Content
Nice to know some history on this., would not be nice if Checkpoint detects the hardware in SmartConsole (which it does), and by doing this disables the bypass feature or enables it according the hardware being used.
Clearly this would only apply to traditionally GW installation, how this would be handled in VSX or Maestro world is another thing.
- Mark as New
- Bookmark
- Subscribe
- Mute
- Subscribe to RSS Feed
- Permalink
- Report Inappropriate Content
Hi,
I'd like to clarify that IPS bypass is a feature that is designed and can be applied to all appliances, SMB and others.
Its true that devices with a smaller amount of resources can be more susceptible to load, however this is also very dependent on the specific traffic patterns and network behavior on a given environment.
In addition I want to share that we are planning a substantial improvement for IPS Bypass in which bypassing will be core specific and will only disable IPS for that core, this should allow preventing connectivity issues related to traffic on that core while retaining IPS security functionality on all other cores.
This improvement will be added to R81.20 JHF and TBD earlier versions.
Also, we are planning additional improvements of automated tuning of IPS so that bypass situations will be much much more targeted and specific, stay tuned..
Please feel free to contact me here yairsp@checkpoint.com
- Mark as New
- Bookmark
- Subscribe
- Mute
- Subscribe to RSS Feed
- Permalink
- Report Inappropriate Content
Hi Timothy,
We are planning a substantial improvement for IPS Bypass in which bypassing will be core specific and will only disable IPS for that core, this should allow preventing connectivity issues related to traffic on that core while retaining IPS security functionality on all other cores.
This improvement will be added to R81.20 JHF and TBD earlier versions.
In addition we are planning additional improvements of automated tuning of IPS so that bypass situations will be much much more targeted and specific, stay tuned..
Please feel free to contact me here yairsp@checkpoint.com
- Mark as New
- Bookmark
- Subscribe
- Mute
- Subscribe to RSS Feed
- Permalink
- Report Inappropriate Content
Excellent, if you could please update this thread when the feature becomes available that would be great.
Attend my 60-minute "Be your Own TAC: Part Deux" Presentation
Exclusively at CPX 2025 Las Vegas Tuesday Feb 25th @ 1:00pm
Exclusively at CPX 2025 Las Vegas Tuesday Feb 25th @ 1:00pm
Leaderboard
Epsum factorial non deposit quid pro quo hic escorol.
| User | Count |
|---|---|
| 3 | |
| 1 | |
| 1 | |
| 1 | |
| 1 |
Upcoming Events
Thu 13 Feb 2025 @ 03:00 AM (CET)
Navigating the Cyber Frontier: A Check Point Executive Briefing - APACThu 13 Feb 2025 @ 03:00 PM (CET)
Navigating the Cyber Frontier: A Check Point Executive Briefing - EMEAThu 13 Feb 2025 @ 02:00 PM (EST)
Navigating the Cyber Frontier: A Check Point Executive Briefing - AmericasFri 14 Feb 2025 @ 10:00 AM (CET)
CheckMates Live Netherlands - Sessie 33: CPX 2025 terugblik!Tue 18 Feb 2025 @ 03:00 PM (CET)
Why Adding SASE to Your Network Infrastructure is a Win-Win - EMEATue 18 Feb 2025 @ 02:00 PM (EST)
Why Adding SASE to Your Network Infrastructure is a Win-Win - AMERICASThu 13 Feb 2025 @ 03:00 AM (CET)
Navigating the Cyber Frontier: A Check Point Executive Briefing - APACThu 13 Feb 2025 @ 03:00 PM (CET)
Navigating the Cyber Frontier: A Check Point Executive Briefing - EMEAThu 13 Feb 2025 @ 02:00 PM (EST)
Navigating the Cyber Frontier: A Check Point Executive Briefing - AmericasFri 14 Feb 2025 @ 10:00 AM (CET)
CheckMates Live Netherlands - Sessie 33: CPX 2025 terugblik!Tue 18 Feb 2025 @ 03:00 PM (CET)
Why Adding SASE to Your Network Infrastructure is a Win-Win - EMEATue 18 Feb 2025 @ 02:00 PM (EST)
Why Adding SASE to Your Network Infrastructure is a Win-Win - AMERICASAbout CheckMates
Learn Check Point
Advanced Learning
YOU DESERVE THE BEST SECURITY
©1994-2025 Check Point Software Technologies Ltd. All rights reserved.
Copyright
Privacy Policy
About Us
UserCenter