Create a Post
cancel
Showing results for 
Search instead for 
Did you mean: 
Alexander_Wilke
Advisor

Skyline - system_cpu_utilization inaccurate with dynamic_balancing enabled

Hello,

I noticed a weired thing after comparing my maestro environment running R81.20 + JumboHFA Take 99 without dynamic balancing and with dynamic balancing enabled.


After I enabled dynamic balancing I could see that the total cpu usage of alle CPUs and all SGMs increase by approximately 80% and on the other hand with similar or less throughput. Traffic mix was the same as this is a production environment.

cpu_usage.png

I opened a ticket with my Diamond support team an we could not find a reason until now but still investigating. We assumed an issue with skyline metrics.

In parallel I tried to find indicators in skyline why it is like it is and I think I found the root cause. Skyline sends metrics every 15s to prometheus. without dynamic balancing we receive the cpu usage for this 15s. the CPU can only have one "type" which is CoreXL_FWD or CoreXL_SND. as the CPUs are assigned statically by cpconfig they can not change its type. As a result One specific CPU has only ohne type within a 15s metric.
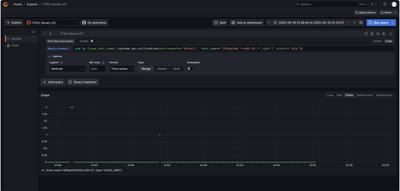
dynamic_balancing_off_cpu_has_only_1_type_within_15s_metrics_interval.png


However a fter enabling dynamic balancing the type of a CPU is not static anymore. it may change and this is expected. A CPU can now have multiple types within one period of 15s. It can be CoreXL_FWD, CoreXL_SND, BOTH, PPE_MGR and others. The result is that in a busy environment with different traffic loads the CPUs type retured for a specific CPU has multiple results. In the following screenshot you can see the see CPU 2 with different states within one 15s period. The result is that "sum" adds these CPU percentages and and because we don't know how long the cpu 2 was FWD and how long it was SND within these 15s we can not build an correct average.


dynamic_balancing_ON_cpu_has_MULTIPLE_types_within_15s_metrics_interval.png


Here is another example which shows that cpu number 2 could have a cpu usage more than 100% within a 15s period.
In the following screenshot over a period of 90s (6x 15s) the CPU usage of this CPU is always over 100% which is impossible and leads me to the conclusion that the defaul skyline behaviour can not handle dynamic balancing properly.

dynamic_balancing_ON_cpu_has_MULTIPLE_types_within_15s_metrics_interval_results_in_more_than_100_percent_usage.png


Another question that has arisen is how the cpivew exporter exports the metrics and how are these aggregated into the 15s push interval. If the cpview exporter would only export every 15s the cpu usage then as a result there would be only one single CPU type. But we can see multiple types which means that cpview exporter exports the CPU metrics multiple times within these 15s interval. In the screenshot above we can see at least 4 types per 15s which lets me assume cpview exporter exports the metrics 4 times and then builds an average?


PS:
In the first screenshot you maybe noted that there are 2 days with high CPU spikes. this was the result of the take 92 bug described in sk183251


How do you measure the CPU reliably usage with skyline and dynamic balancing?

0 Kudos
10 Replies
Henrik_Noerr1
Advisor

Great investigation Alexander - We are struggling with the same issue. 

As much as open telemetry brings, I think the implementation still has some ways to go. Furthermore when using UPPAK - usim is fully loading all allocated SND cores to 100% which may compound the issue. 

Following here for any CP feedback.

/Henrik

JozkoMrkvicka
Authority
Authority

@Elad_Chomsky and/or @Arik_Ovtracht, can someone of you have a look on issue mentioned by @Alexander_Wilke ?

Kind regards,
Jozko Mrkvicka
0 Kudos
Alexander_Wilke
Advisor

Any feedback here?
Unfortunately my diamond team does not have any feedback, too.
Not so amazing

0 Kudos
Elad_Chomsky
Employee
Employee

Hi,

OpenTelemetry reports metrics with labels for each CPU type, so when a label changes, a new series is created. This can sometimes cause unexpected changes—if you see erratic behavior, please open a support ticket and we’ll investigate.

When querying by type and hostname, each CPU is only reported once. The CPView exporter samples every 15 seconds, so only one measurement per interval is exposed. For detailed tracking, you can enable debug mode:

sklnctl export --debug /path/to/debug.json

(Disable with sklnctl export --debug-stop)

It’s possible that dynamic split or a sudden change is affecting measurements. I recommend checking CPView History for any unusual spikes or changes.

If you have a ticket number, please share it and I’ll update you directly. Let me know if you need more help!

Thanks,
Elad

0 Kudos
Alexander_Wilke
Advisor

Hello @Elad 

as you can see in the last 2 screenshots it is always CPU2 and it has multiple types at one measument. you can see the grafana dashboard interval and each point is 15s. this is the skyline push interval as you said and it is the datasource query interval.


So I think it is clear that the same CPU 2 is reporting two types at the same time.

CPview history will not help as it only has 1minute history steps. But we do not jneed cpview history, we can use skyline history which is in the first screenshot and the red and blue bopx explains the situation before and after dynamic balancing enabled.

my ticket: 6-0004284473

0 Kudos
Elad_Chomsky
Employee
Employee

Hi @Alexander_Wilke ,

What you’re seeing is likely due to how the query aggregates the data—if you view the relevant individual series, you should see the correct sample intervals. For reference, our measurements are recorded once every 15 seconds, and the baseline data comes directly from CPView, with a single line per CPU. We do not aggregate this data; any cumulative values are only per series.

The way the data appears can depend on how Grafana and Prometheus process the raw data. If you notice any discrepancies in the raw samples themselves, please let us know—we can investigate further using debug tools if needed.

I also wanted to mention that the team is currently looking into this internally. I’ll make sure your concerns are included in their review.

Thanks, Elad

0 Kudos
Vincent_Bacher
Advisor
Advisor


@Elad_Chomsky wrote:

For reference, our measurements are recorded once every 15 seconds, and the baseline data comes directly from CPView


Hi Elad,

for the sake of completeness, it should be mentioned that the invervall is adjustable.

An interval of 15 seconds is too short, especially for VSX with many VS, as this can lead to memory problems. Furthermore, Prometheus receives too many time series, which may not be desirable in larger environments.

br
Vincent

and now to something completely different - CCVS, CCAS, CCTE, CCCS, CCSM elite
0 Kudos
Alexander_Wilke
Advisor

For CPviewExporter you can adjust it:

/opt/CPviewExporter/CPviewExporterCli.sh cpview_exporter refresh_rate (<Num>(s|h|m)|delete) - Set the refresh rate ( Delete = Back to default ) interval for the CPView Exporter

However this is probably useless because the otelcol component sends the data every 15s. If this is not alligned with CPviewExport and not alligned with OtlpAgent Export, it will result in wrong data.

Lets assume you export data from Cpview every 1m and otelcol pushes it to the destination every 15s then you get the same value 4 times without any change.

Your concern with time series I think is not correct. A time series is a unique comination set of labels. it will not change number of time series if you export every 15s oder 1s oder 60s. In addition you have every time series active for at least 5m even without any data because prometheus add the stale marker only after 5minutes of no update.


What you probably mean are samples. a sample is one point of time of a time series.


But I agree - setting the push interval for all components would help. 15s is a good value to get spikes, sometimes I would like to have shorter values like 5s. however only for very specific metrics like connection rate or CPU but longer intervals like 2m or max 5m for hdd, or blade statatus, policy install time, jumbo hf version, ...

0 Kudos
Vincent_Bacher
Advisor
Advisor

I know the way to adjust it but thanks 😉

Rrgarding allignment between the components, you are absolutely right, thanks for pointing out.
As this is an issue to be solved asap, i already contacted our CP PS engineer to liaise with R&D to fix that.

And yes, i meant samples, not time series. My bad caused by doing too many things at the same time


and now to something completely different - CCVS, CCAS, CCTE, CCCS, CCSM elite
0 Kudos
Alexander_Wilke
Advisor

Hello @Elad_Chomsky 

your assumtion about aggregation is wrong i think.

i did sum to aggregate the states (usr, system, i/o wait, ..). this allows me to better see total cpu usage by type (SND; CoreXL, Both, PPE, ..).

Here without any aggregation, the result is the same, nearly 200% CPU usage per measurement for a single cpu core.
However now it is more difficulty to read because now you have  3 x state (system, user, i/o wait) and 4 x type (FWD, CoreXL, SND, BOTH) which is 3 x 4 = 12 colors.


Screenshot 2025-06-26 084308.png


0 Kudos
Upcoming Events

    CheckMates Events