- CheckMates
- :
- Products
- :
- CloudMates Products
- :
- CNAPP
- :
- New CloudGuard Dome9 Public Preview: New Dashboard...
- Subscribe to RSS Feed
- Mark Topic as New
- Mark Topic as Read
- Float this Topic for Current User
- Bookmark
- Subscribe
- Mute
- Printer Friendly Page
Are you a member of CheckMates?
×- Mark as New
- Bookmark
- Subscribe
- Mute
- Subscribe to RSS Feed
- Permalink
- Report Inappropriate Content
New CloudGuard Dome9 Public Preview: New Dashboards
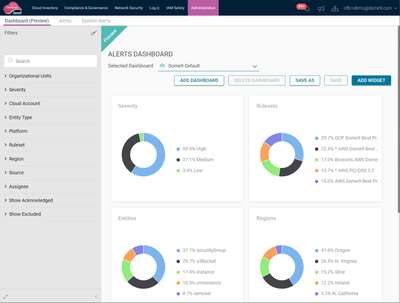
We're happy to introduce the new Dome9 dashboards!
The dashboards provide new, powerful capabilities to present information from various sources. The dashboards can present information in various formats and breakdowns, such as "Top" (i.e. "cloud accounts with most alerts"), pie charts (i.e. "breakdown by severity"), and "latest" (i.e. "latest generated findings").
The dashboards can be filtered according to needs, and allow you to focus on information relevant to the current logged in user. For example, you can filter the dashboard to focus on specific cloud platform, region, or type of entities.
We provide default "Dome9" dashboards, starting with the Compliance alerts. The dashboards are customizable - you can create your own dashboards. Dashboards are saved with the applied filters, this allows to create dashboards for specific use cases. For example: "The state of Serverless", focusing on the security posture of serverless services; "GDPR Dashboard", focusing on alerts that are relevant for specific compliance frameworks; "My Team Dashboard" that would present information that is relevant for my team only; and more.
Clicking on the data leads you to the alerts console, filtered according to the clicked element.
The new Alerts Dashboard is now the default view of alerts. You can switch to the alerts tab and look at the "raw" alerts information.
Please use the new capabilities, we'd love your feedback!


