- Products
- Learn
- Local User Groups
- Partners
- More

Scaling Check Point Automation with Arodonata
7 October @ 5pm CET / 11am EDT
AI Security Masters
LGTM: Bypassing an LLM Build Gate
When Prompt Injection Fails
What's New in Check Point SASE
The State of Ransomware Q2 2026:
This Quarter's Trends, and Their Impact on Your Defenses
CheckMates Go:
Half is Not Enough
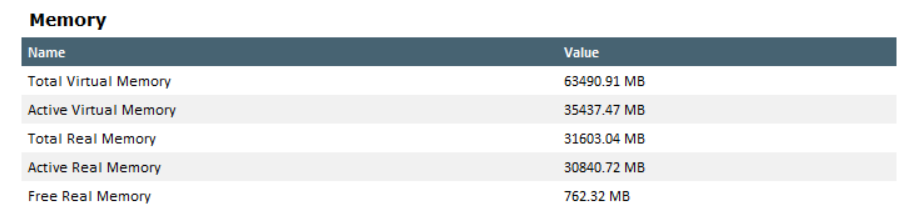
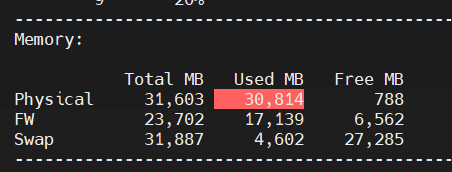
We have checkpoint security gateway 7000 appliance. Recently the memory usage is above 90%. How can we know, which process is running more memory?
We have checkpoint security gateway 7000 appliance. Recently the memory usage is above 90%. How can we know, which process is running more memory?
We have checkpoint security gateway 7000 appliance. Recently the memory usage is above 90%. How can we know, which process is running more memory?
We have checkpoint security gateway 7000 appliance. Recently the memory usage is above 90%. How can we know, which process is running more memory?
We have checkpoint security gateway 7000 appliance. Recently the memory usage is above 90%. How can we know, which process is running more memory?
We have checkpoint security gateway 7000 appliance. Recently the memory usage is above 90%. How can we know, which process is running more memory?
We have checkpoint security gateway 7000 appliance. Recently the memory usage is above 90%. How can we know, which process is running more memory?
We have checkpoint security gateway 7000 appliance. Recently the memory usage is above 90%. How can we know, which process is running more memory?
We have checkpoint security gateway 7000 appliance. Recently the memory usage is above 90%. How can we know, which process is running more memory?
We have checkpoint security gateway 7000 appliance. Recently the memory usage is above 90%. How can we know, which process is running more memory?
We have checkpoint security gateway 7000 appliance. Recently the memory usage is above 90%. How can we know, which process is running more memory?
We have checkpoint security gateway 7000 appliance. Recently the memory usage is above 90%. How can we know, which process is running more memory?
We have checkpoint security gateway 7000 appliance. Recently the memory usage is above 90%. How can we know, which process is running more memory?
We have checkpoint security gateway 7000 appliance. Recently the memory usage is above 90%. How can we know, which process is running more memory?
We have checkpoint security gateway 7000 appliance. Recently the memory usage is above 90%. How can we know, which process is running more memory?
We have checkpoint security gateway 7000 appliance. Recently the memory usage is above 90%. How can we know, which process is running more memory?
We have checkpoint security gateway 7000 appliance. Recently the memory usage is above 90%. How can we know, which process is running more memory?
We have checkpoint security gateway 7000 appliance. Recently the memory usage is above 90%. How can we know, which process is running more memory?
We have checkpoint security gateway 7000 appliance. Recently the memory usage is above 90%. How can we know, which process is running more memory?
We have checkpoint security gateway 7000 appliance. Recently the memory usage is above 90%. How can we know, which process is running more memory?
We have checkpoint security gateway 7000 appliance. Recently the memory usage is above 90%. How can we know, which process is running more memory?
We have checkpoint security gateway 7000 appliance. Recently the memory usage is above 90%. How can we know, which process is running more memory?
We have checkpoint security gateway 7000 appliance. Recently the memory usage is above 90%. How can we know, which process is running more memory?
We have checkpoint security gateway 7000 appliance. Recently the memory usage is above 90%. How can we know, which process is running more memory?
We have checkpoint security gateway 7000 appliance. Recently the memory usage is above 90%. How can we know, which process is running more memory?
We have checkpoint security gateway 7000 appliance. Recently the memory usage is above 90%. How can we know, which process is running more memory?
We have checkpoint security gateway 7000 appliance. Recently the memory usage is above 90%. How can we know, which process is running more memory?
We have checkpoint security gateway 7000 appliance. Recently the memory usage is above 90%. How can we know, which process is running more memory?
We have checkpoint security gateway 7000 appliance. Recently the memory usage is above 90%. How can we know, which process is running more memory?
We have checkpoint security gateway 7000 appliance. Recently the memory usage is above 90%. How can we know, which process is running more memory?
We have checkpoint security gateway 7000 appliance. Recently the memory usage is above 90%. How can we know, which process is running more memory?
We have checkpoint security gateway 7000 appliance. Recently the memory usage is above 90%. How can we know, which process is running more memory?
We have checkpoint security gateway 7000 appliance. Recently the memory usage is above 90%. How can we know, which process is running more memory?
We have checkpoint security gateway 7000 appliance. Recently the memory usage is above 90%. How can we know, which process is running more memory?
We have checkpoint security gateway 7000 appliance. Recently the memory usage is above 90%. How can we know, which process is running more memory?
We have checkpoint security gateway 7000 appliance. Recently the memory usage is above 90%. How can we know, which process is running more memory?
We have checkpoint security gateway 7000 appliance. Recently the memory usage is above 90%. How can we know, which process is running more memory?
We have checkpoint security gateway 7000 appliance. Recently the memory usage is above 90%. How can we know, which process is running more memory?
We have checkpoint security gateway 7000 appliance. Recently the memory usage is above 90%. How can we know, which process is running more memory?


K, so you have both threat emulation AND threat extraction, wondering if that could be related to this. Can you run cpview again quick when you log in and see what is the current usage at the moment?
Lets do remote when you have 15-20 mins, I can have a look.
Let me know.
Cheers mate.
K, so you have both threat emulation AND threat extraction, wondering if that could be related to this. Can you run cpview again quick when you log in and see what is the current usage at the moment?
Lets do remote when you have 15-20 mins, I can have a look.
Let me know.
Cheers mate.
K, so you have both threat emulation AND threat extraction, wondering if that could be related to this. Can you run cpview again quick when you log in and see what is the current usage at the moment?
Lets do remote when you have 15-20 mins, I can have a look.
Let me know.
Cheers mate.
K, so you have both threat emulation AND threat extraction, wondering if that could be related to this. Can you run cpview again quick when you log in and see what is the current usage at the moment?
Lets do remote when you have 15-20 mins, I can have a look.
Let me know.
Cheers mate.
K, so you have both threat emulation AND threat extraction, wondering if that could be related to this. Can you run cpview again quick when you log in and see what is the current usage at the moment?
Lets do remote when you have 15-20 mins, I can have a look.
Let me know.
Cheers mate.
K, so you have both threat emulation AND threat extraction, wondering if that could be related to this. Can you run cpview again quick when you log in and see what is the current usage at the moment?
Lets do remote when you have 15-20 mins, I can have a look.
Let me know.
Cheers mate.
K, so you have both threat emulation AND threat extraction, wondering if that could be related to this. Can you run cpview again quick when you log in and see what is the current usage at the moment?
Lets do remote when you have 15-20 mins, I can have a look.
Let me know.
Cheers mate.
K, so you have both threat emulation AND threat extraction, wondering if that could be related to this. Can you run cpview again quick when you log in and see what is the current usage at the moment?
Lets do remote when you have 15-20 mins, I can have a look.
Let me know.
Cheers mate.
K, so you have both threat emulation AND threat extraction, wondering if that could be related to this. Can you run cpview again quick when you log in and see what is the current usage at the moment?
Lets do remote when you have 15-20 mins, I can have a look.
Let me know.
Cheers mate.
K, so you have both threat emulation AND threat extraction, wondering if that could be related to this. Can you run cpview again quick when you log in and see what is the current usage at the moment?
Lets do remote when you have 15-20 mins, I can have a look.
Let me know.
Cheers mate.
K, so you have both threat emulation AND threat extraction, wondering if that could be related to this. Can you run cpview again quick when you log in and see what is the current usage at the moment?
Lets do remote when you have 15-20 mins, I can have a look.
Let me know.
Cheers mate.
K, so you have both threat emulation AND threat extraction, wondering if that could be related to this. Can you run cpview again quick when you log in and see what is the current usage at the moment?
Lets do remote when you have 15-20 mins, I can have a look.
Let me know.
Cheers mate.
K, so you have both threat emulation AND threat extraction, wondering if that could be related to this. Can you run cpview again quick when you log in and see what is the current usage at the moment?
Lets do remote when you have 15-20 mins, I can have a look.
Let me know.
Cheers mate.
K, so you have both threat emulation AND threat extraction, wondering if that could be related to this. Can you run cpview again quick when you log in and see what is the current usage at the moment?
Lets do remote when you have 15-20 mins, I can have a look.
Let me know.
Cheers mate.
K, so you have both threat emulation AND threat extraction, wondering if that could be related to this. Can you run cpview again quick when you log in and see what is the current usage at the moment?
Lets do remote when you have 15-20 mins, I can have a look.
Let me know.
Cheers mate.
K, so you have both threat emulation AND threat extraction, wondering if that could be related to this. Can you run cpview again quick when you log in and see what is the current usage at the moment?
Lets do remote when you have 15-20 mins, I can have a look.
Let me know.
Cheers mate.
K, so you have both threat emulation AND threat extraction, wondering if that could be related to this. Can you run cpview again quick when you log in and see what is the current usage at the moment?
Lets do remote when you have 15-20 mins, I can have a look.
Let me know.
Cheers mate.
K, so you have both threat emulation AND threat extraction, wondering if that could be related to this. Can you run cpview again quick when you log in and see what is the current usage at the moment?
Lets do remote when you have 15-20 mins, I can have a look.
Let me know.
Cheers mate.
K, so you have both threat emulation AND threat extraction, wondering if that could be related to this. Can you run cpview again quick when you log in and see what is the current usage at the moment?
Lets do remote when you have 15-20 mins, I can have a look.
Let me know.
Cheers mate.
K, so you have both threat emulation AND threat extraction, wondering if that could be related to this. Can you run cpview again quick when you log in and see what is the current usage at the moment?
Lets do remote when you have 15-20 mins, I can have a look.
Let me know.
Cheers mate.
K, so you have both threat emulation AND threat extraction, wondering if that could be related to this. Can you run cpview again quick when you log in and see what is the current usage at the moment?
Lets do remote when you have 15-20 mins, I can have a look.
Let me know.
Cheers mate.

 Chris_Atkinson
Chris_Atkinson
Chris_Atkinson
Chris_Atkinson
Chris_Atkinson
Chris_Atkinson
Chris_Atkinson
Chris_Atkinson
Chris_Atkinson
Chris_Atkinson
Chris_Atkinson
Chris_Atkinson
Chris_Atkinson
Chris_Atkinson
Chris_Atkinson
Chris_Atkinson
Chris_Atkinson
Chris_Atkinson
Chris_Atkinson
Chris_Atkinson
Chris_Atkinson
Chris_Atkinson
Chris_Atkinson
Chris_Atkinson
Chris_Atkinson
Chris_Atkinson
Chris_Atkinson
Chris_Atkinson
Chris_Atkinson
Chris_Atkinson
Chris_Atkinson
Chris_Atkinson
Chris_Atkinson
Chris_Atkinson
Chris_Atkinson
Chris_Atkinson
Chris_Atkinson
Chris_Atkinson
Chris_Atkinson
Chris_Atkinson
Chris_Atkinson
How much traffic, connections & throughput is the appliance handling whilst these blades are enabled?
Drip feeding the answers is not helping. Without all the information we cannot suggest anything different than we already have.
How much traffic, connections & throughput is the appliance handling whilst these blades are enabled?
Drip feeding the answers is not helping. Without all the information we cannot suggest anything different than we already have.
How much traffic, connections & throughput is the appliance handling whilst these blades are enabled?
Drip feeding the answers is not helping. Without all the information we cannot suggest anything different than we already have.
How much traffic, connections & throughput is the appliance handling whilst these blades are enabled?
Drip feeding the answers is not helping. Without all the information we cannot suggest anything different than we already have.
How much traffic, connections & throughput is the appliance handling whilst these blades are enabled?
Drip feeding the answers is not helping. Without all the information we cannot suggest anything different than we already have.
How much traffic, connections & throughput is the appliance handling whilst these blades are enabled?
Drip feeding the answers is not helping. Without all the information we cannot suggest anything different than we already have.
How much traffic, connections & throughput is the appliance handling whilst these blades are enabled?
Drip feeding the answers is not helping. Without all the information we cannot suggest anything different than we already have.
How much traffic, connections & throughput is the appliance handling whilst these blades are enabled?
Drip feeding the answers is not helping. Without all the information we cannot suggest anything different than we already have.
How much traffic, connections & throughput is the appliance handling whilst these blades are enabled?
Drip feeding the answers is not helping. Without all the information we cannot suggest anything different than we already have.
How much traffic, connections & throughput is the appliance handling whilst these blades are enabled?
Drip feeding the answers is not helping. Without all the information we cannot suggest anything different than we already have.
How much traffic, connections & throughput is the appliance handling whilst these blades are enabled?
Drip feeding the answers is not helping. Without all the information we cannot suggest anything different than we already have.
How much traffic, connections & throughput is the appliance handling whilst these blades are enabled?
Drip feeding the answers is not helping. Without all the information we cannot suggest anything different than we already have.
How much traffic, connections & throughput is the appliance handling whilst these blades are enabled?
Drip feeding the answers is not helping. Without all the information we cannot suggest anything different than we already have.
How much traffic, connections & throughput is the appliance handling whilst these blades are enabled?
Drip feeding the answers is not helping. Without all the information we cannot suggest anything different than we already have.
How much traffic, connections & throughput is the appliance handling whilst these blades are enabled?
Drip feeding the answers is not helping. Without all the information we cannot suggest anything different than we already have.
How much traffic, connections & throughput is the appliance handling whilst these blades are enabled?
Drip feeding the answers is not helping. Without all the information we cannot suggest anything different than we already have.
How much traffic, connections & throughput is the appliance handling whilst these blades are enabled?
Drip feeding the answers is not helping. Without all the information we cannot suggest anything different than we already have.
How much traffic, connections & throughput is the appliance handling whilst these blades are enabled?
Drip feeding the answers is not helping. Without all the information we cannot suggest anything different than we already have.
How much traffic, connections & throughput is the appliance handling whilst these blades are enabled?
Drip feeding the answers is not helping. Without all the information we cannot suggest anything different than we already have.
How much traffic, connections & throughput is the appliance handling whilst these blades are enabled?
Drip feeding the answers is not helping. Without all the information we cannot suggest anything different than we already have.
How much traffic, connections & throughput is the appliance handling whilst these blades are enabled?
Drip feeding the answers is not helping. Without all the information we cannot suggest anything different than we already have.
I think, in all fiarness, @gemechisd is trying to give us as much info, but its bit tricky without possible remote session...just my 2 cents.
I think, in all fiarness, @gemechisd is trying to give us as much info, but its bit tricky without possible remote session...just my 2 cents.
I think, in all fiarness, @gemechisd is trying to give us as much info, but its bit tricky without possible remote session...just my 2 cents.
I think, in all fiarness, @gemechisd is trying to give us as much info, but its bit tricky without possible remote session...just my 2 cents.
I think, in all fiarness, @gemechisd is trying to give us as much info, but its bit tricky without possible remote session...just my 2 cents.
I think, in all fiarness, @gemechisd is trying to give us as much info, but its bit tricky without possible remote session...just my 2 cents.
I think, in all fiarness, @gemechisd is trying to give us as much info, but its bit tricky without possible remote session...just my 2 cents.
I think, in all fiarness, @gemechisd is trying to give us as much info, but its bit tricky without possible remote session...just my 2 cents.
I think, in all fiarness, @gemechisd is trying to give us as much info, but its bit tricky without possible remote session...just my 2 cents.
I think, in all fiarness, @gemechisd is trying to give us as much info, but its bit tricky without possible remote session...just my 2 cents.
I think, in all fiarness, @gemechisd is trying to give us as much info, but its bit tricky without possible remote session...just my 2 cents.
I think, in all fiarness, @gemechisd is trying to give us as much info, but its bit tricky without possible remote session...just my 2 cents.
I think, in all fiarness, @gemechisd is trying to give us as much info, but its bit tricky without possible remote session...just my 2 cents.
I think, in all fiarness, @gemechisd is trying to give us as much info, but its bit tricky without possible remote session...just my 2 cents.
I think, in all fiarness, @gemechisd is trying to give us as much info, but its bit tricky without possible remote session...just my 2 cents.
I think, in all fiarness, @gemechisd is trying to give us as much info, but its bit tricky without possible remote session...just my 2 cents.
I think, in all fiarness, @gemechisd is trying to give us as much info, but its bit tricky without possible remote session...just my 2 cents.
I think, in all fiarness, @gemechisd is trying to give us as much info, but its bit tricky without possible remote session...just my 2 cents.
I think, in all fiarness, @gemechisd is trying to give us as much info, but its bit tricky without possible remote session...just my 2 cents.
I think, in all fiarness, @gemechisd is trying to give us as much info, but its bit tricky without possible remote session...just my 2 cents.
I think, in all fiarness, @gemechisd is trying to give us as much info, but its bit tricky without possible remote session...just my 2 cents.
Chris_Atkinson
Chris_Atkinson
Chris_Atkinson
Chris_Atkinson
Chris_Atkinson
Chris_Atkinson
Chris_Atkinson
Chris_Atkinson
Chris_Atkinson
Chris_Atkinson
Chris_Atkinson
Chris_Atkinson
Chris_Atkinson
Chris_Atkinson
Chris_Atkinson
Chris_Atkinson
Chris_Atkinson
Chris_Atkinson
Chris_Atkinson
Chris_Atkinson
Chris_Atkinson
Perhaps but likely TAC would have all the data in a cpinfo already if they've been engaged...
Perhaps but likely TAC would have all the data in a cpinfo already if they've been engaged...
Perhaps but likely TAC would have all the data in a cpinfo already if they've been engaged...
Perhaps but likely TAC would have all the data in a cpinfo already if they've been engaged...
Perhaps but likely TAC would have all the data in a cpinfo already if they've been engaged...
Perhaps but likely TAC would have all the data in a cpinfo already if they've been engaged...
Perhaps but likely TAC would have all the data in a cpinfo already if they've been engaged...
Perhaps but likely TAC would have all the data in a cpinfo already if they've been engaged...
Perhaps but likely TAC would have all the data in a cpinfo already if they've been engaged...
Perhaps but likely TAC would have all the data in a cpinfo already if they've been engaged...
Perhaps but likely TAC would have all the data in a cpinfo already if they've been engaged...
Perhaps but likely TAC would have all the data in a cpinfo already if they've been engaged...
Perhaps but likely TAC would have all the data in a cpinfo already if they've been engaged...
Perhaps but likely TAC would have all the data in a cpinfo already if they've been engaged...
Perhaps but likely TAC would have all the data in a cpinfo already if they've been engaged...
Perhaps but likely TAC would have all the data in a cpinfo already if they've been engaged...
Perhaps but likely TAC would have all the data in a cpinfo already if they've been engaged...
Perhaps but likely TAC would have all the data in a cpinfo already if they've been engaged...
Perhaps but likely TAC would have all the data in a cpinfo already if they've been engaged...
Perhaps but likely TAC would have all the data in a cpinfo already if they've been engaged...
Perhaps but likely TAC would have all the data in a cpinfo already if they've been engaged...
Good point Chris. @gemechisd do you have TAC case open? If you have cpinfo, Im happy to review it myself as well if you can share it securely.
Cheers mate.
Good point Chris. @gemechisd do you have TAC case open? If you have cpinfo, Im happy to review it myself as well if you can share it securely.
Cheers mate.
Good point Chris. @gemechisd do you have TAC case open? If you have cpinfo, Im happy to review it myself as well if you can share it securely.
Cheers mate.
Good point Chris. @gemechisd do you have TAC case open? If you have cpinfo, Im happy to review it myself as well if you can share it securely.
Cheers mate.
Good point Chris. @gemechisd do you have TAC case open? If you have cpinfo, Im happy to review it myself as well if you can share it securely.
Cheers mate.
Good point Chris. @gemechisd do you have TAC case open? If you have cpinfo, Im happy to review it myself as well if you can share it securely.
Cheers mate.
Good point Chris. @gemechisd do you have TAC case open? If you have cpinfo, Im happy to review it myself as well if you can share it securely.
Cheers mate.
Good point Chris. @gemechisd do you have TAC case open? If you have cpinfo, Im happy to review it myself as well if you can share it securely.
Cheers mate.
Good point Chris. @gemechisd do you have TAC case open? If you have cpinfo, Im happy to review it myself as well if you can share it securely.
Cheers mate.
Good point Chris. @gemechisd do you have TAC case open? If you have cpinfo, Im happy to review it myself as well if you can share it securely.
Cheers mate.
Good point Chris. @gemechisd do you have TAC case open? If you have cpinfo, Im happy to review it myself as well if you can share it securely.
Cheers mate.
Good point Chris. @gemechisd do you have TAC case open? If you have cpinfo, Im happy to review it myself as well if you can share it securely.
Cheers mate.
Good point Chris. @gemechisd do you have TAC case open? If you have cpinfo, Im happy to review it myself as well if you can share it securely.
Cheers mate.
Good point Chris. @gemechisd do you have TAC case open? If you have cpinfo, Im happy to review it myself as well if you can share it securely.
Cheers mate.
Good point Chris. @gemechisd do you have TAC case open? If you have cpinfo, Im happy to review it myself as well if you can share it securely.
Cheers mate.
Good point Chris. @gemechisd do you have TAC case open? If you have cpinfo, Im happy to review it myself as well if you can share it securely.
Cheers mate.
Good point Chris. @gemechisd do you have TAC case open? If you have cpinfo, Im happy to review it myself as well if you can share it securely.
Cheers mate.
Good point Chris. @gemechisd do you have TAC case open? If you have cpinfo, Im happy to review it myself as well if you can share it securely.
Cheers mate.
Good point Chris. @gemechisd do you have TAC case open? If you have cpinfo, Im happy to review it myself as well if you can share it securely.
Cheers mate.
Good point Chris. @gemechisd do you have TAC case open? If you have cpinfo, Im happy to review it myself as well if you can share it securely.
Cheers mate.
Good point Chris. @gemechisd do you have TAC case open? If you have cpinfo, Im happy to review it myself as well if you can share it securely.
Cheers mate.
I would check below commands:
free -m
top
ps -auxw
cpview
cpwd_admin list
I would check below commands:
free -m
top
ps -auxw
cpview
cpwd_admin list
I would check below commands:
free -m
top
ps -auxw
cpview
cpwd_admin list
I would check below commands:
free -m
top
ps -auxw
cpview
cpwd_admin list
I would check below commands:
free -m
top
ps -auxw
cpview
cpwd_admin list
I would check below commands:
free -m
top
ps -auxw
cpview
cpwd_admin list
I would check below commands:
free -m
top
ps -auxw
cpview
cpwd_admin list
I would check below commands:
free -m
top
ps -auxw
cpview
cpwd_admin list
I would check below commands:
free -m
top
ps -auxw
cpview
cpwd_admin list
I would check below commands:
free -m
top
ps -auxw
cpview
cpwd_admin list
I would check below commands:
free -m
top
ps -auxw
cpview
cpwd_admin list
I would check below commands:
free -m
top
ps -auxw
cpview
cpwd_admin list
I would check below commands:
free -m
top
ps -auxw
cpview
cpwd_admin list
I would check below commands:
free -m
top
ps -auxw
cpview
cpwd_admin list
I would check below commands:
free -m
top
ps -auxw
cpview
cpwd_admin list
I would check below commands:
free -m
top
ps -auxw
cpview
cpwd_admin list
I would check below commands:
free -m
top
ps -auxw
cpview
cpwd_admin list
I would check below commands:
free -m
top
ps -auxw
cpview
cpwd_admin list
I would check below commands:
free -m
top
ps -auxw
cpview
cpwd_admin list
I would check below commands:
free -m
top
ps -auxw
cpview
cpwd_admin list
I would check below commands:
free -m
top
ps -auxw
cpview
cpwd_admin list

Hello @gemechisd ,
So you have an Quantum 7K with (I assume as you didn't specify) 32Gb of RAM and with all the blades enabled (as you showed in the last post, and you complain that the memory is 90-95% utilized ?
I mean, what would you expect? Isn't that what's the memory there for? to be utilized ?
In our case we're having OLD 15600 in our clusters (currently at 32Gb of RAM), and with almost all the blades enabled (we're not doing VPN from the appliances, therefore IPsec VPN and Mobile Access are not active in our case, and also Content Awareness, but we have also the DLP, QOS, Identity Awareness and HTTPS Inspection that are eating their chunk of Memory 😊) we're around 75 - 90% of memory.
Therefore, this weekend we're adding another 32Gb so we will be at 64Gb tops, so we're expecting the appliance to be around 50-70% of memory utilization, as we also intend to make use of SandBlast Blades (Threat Emulation and Extraction) by adopting Autonomous Threat Prevention.
So please do "Execute the command enabled_blades in expert mode" like @PhoneBoy asked, and not a SmarConsole screenshot.... (we have HTTPS Inspection enabled and that is not showing on License Status page!!!!!)
Bottom-line, since you enabled all that was possible, and your appliance isn't MAX out from resource perspective, I would say it's normal behavior. If you want to lower that, then disable blades that are not used, and configure/fine-tune the others and you will be at an 75% maybe. But my recommendation, would be to go ahead and MAX the memory from the appliance, and then you won't bother about that part. Plus you will be able to make use of other blades, without any resource concerns.
Thank you,
PS: that reminds me of some ticket/alert of riverbeds equipment's in our environment, being all the time at 90-95% of the memory. and my response on that, was "is there any issue with the data Optimization that RB does, if not, why we care of smth like that since the RB functions in it's parameters and there were not thresholds triggered, like the RB guys have set/defined...." The box was normal to be on 90-95% memory utilization as it's made to process data in a specific way.
PS2: it's a bit tough to say what program/blade uses what quantity of memory, since they split in multiple instances that are running in parallel, therefore the recommendation to dump the unused blades is the first one, followed by the ticking of the remaining ones.
PS3: in our case, we are getting currently to an 98% of memory utilization, when we spike 300-500K connections (in the past we got also 1MIL connections) and that was increasing memory consumption, therefore our decision to MAX our the resources, in this case memory.
Hello @gemechisd ,
So you have an Quantum 7K with (I assume as you didn't specify) 32Gb of RAM and with all the blades enabled (as you showed in the last post, and you complain that the memory is 90-95% utilized ?
I mean, what would you expect? Isn't that what's the memory there for? to be utilized ?
In our case we're having OLD 15600 in our clusters (currently at 32Gb of RAM), and with almost all the blades enabled (we're not doing VPN from the appliances, therefore IPsec VPN and Mobile Access are not active in our case, and also Content Awareness, but we have also the DLP, QOS, Identity Awareness and HTTPS Inspection that are eating their chunk of Memory 😊) we're around 75 - 90% of memory.
Therefore, this weekend we're adding another 32Gb so we will be at 64Gb tops, so we're expecting the appliance to be around 50-70% of memory utilization, as we also intend to make use of SandBlast Blades (Threat Emulation and Extraction) by adopting Autonomous Threat Prevention.
So please do "Execute the command enabled_blades in expert mode" like @PhoneBoy asked, and not a SmarConsole screenshot.... (we have HTTPS Inspection enabled and that is not showing on License Status page!!!!!)
Bottom-line, since you enabled all that was possible, and your appliance isn't MAX out from resource perspective, I would say it's normal behavior. If you want to lower that, then disable blades that are not used, and configure/fine-tune the others and you will be at an 75% maybe. But my recommendation, would be to go ahead and MAX the memory from the appliance, and then you won't bother about that part. Plus you will be able to make use of other blades, without any resource concerns.
Thank you,
PS: that reminds me of some ticket/alert of riverbeds equipment's in our environment, being all the time at 90-95% of the memory. and my response on that, was "is there any issue with the data Optimization that RB does, if not, why we care of smth like that since the RB functions in it's parameters and there were not thresholds triggered, like the RB guys have set/defined...." The box was normal to be on 90-95% memory utilization as it's made to process data in a specific way.
PS2: it's a bit tough to say what program/blade uses what quantity of memory, since they split in multiple instances that are running in parallel, therefore the recommendation to dump the unused blades is the first one, followed by the ticking of the remaining ones.
PS3: in our case, we are getting currently to an 98% of memory utilization, when we spike 300-500K connections (in the past we got also 1MIL connections) and that was increasing memory consumption, therefore our decision to MAX our the resources, in this case memory.
Hello @gemechisd ,
So you have an Quantum 7K with (I assume as you didn't specify) 32Gb of RAM and with all the blades enabled (as you showed in the last post, and you complain that the memory is 90-95% utilized ?
I mean, what would you expect? Isn't that what's the memory there for? to be utilized ?
In our case we're having OLD 15600 in our clusters (currently at 32Gb of RAM), and with almost all the blades enabled (we're not doing VPN from the appliances, therefore IPsec VPN and Mobile Access are not active in our case, and also Content Awareness, but we have also the DLP, QOS, Identity Awareness and HTTPS Inspection that are eating their chunk of Memory 😊) we're around 75 - 90% of memory.
Therefore, this weekend we're adding another 32Gb so we will be at 64Gb tops, so we're expecting the appliance to be around 50-70% of memory utilization, as we also intend to make use of SandBlast Blades (Threat Emulation and Extraction) by adopting Autonomous Threat Prevention.
So please do "Execute the command enabled_blades in expert mode" like @PhoneBoy asked, and not a SmarConsole screenshot.... (we have HTTPS Inspection enabled and that is not showing on License Status page!!!!!)
Bottom-line, since you enabled all that was possible, and your appliance isn't MAX out from resource perspective, I would say it's normal behavior. If you want to lower that, then disable blades that are not used, and configure/fine-tune the others and you will be at an 75% maybe. But my recommendation, would be to go ahead and MAX the memory from the appliance, and then you won't bother about that part. Plus you will be able to make use of other blades, without any resource concerns.
Thank you,
PS: that reminds me of some ticket/alert of riverbeds equipment's in our environment, being all the time at 90-95% of the memory. and my response on that, was "is there any issue with the data Optimization that RB does, if not, why we care of smth like that since the RB functions in it's parameters and there were not thresholds triggered, like the RB guys have set/defined...." The box was normal to be on 90-95% memory utilization as it's made to process data in a specific way.
PS2: it's a bit tough to say what program/blade uses what quantity of memory, since they split in multiple instances that are running in parallel, therefore the recommendation to dump the unused blades is the first one, followed by the ticking of the remaining ones.
PS3: in our case, we are getting currently to an 98% of memory utilization, when we spike 300-500K connections (in the past we got also 1MIL connections) and that was increasing memory consumption, therefore our decision to MAX our the resources, in this case memory.
Hello @gemechisd ,
So you have an Quantum 7K with (I assume as you didn't specify) 32Gb of RAM and with all the blades enabled (as you showed in the last post, and you complain that the memory is 90-95% utilized ?
I mean, what would you expect? Isn't that what's the memory there for? to be utilized ?
In our case we're having OLD 15600 in our clusters (currently at 32Gb of RAM), and with almost all the blades enabled (we're not doing VPN from the appliances, therefore IPsec VPN and Mobile Access are not active in our case, and also Content Awareness, but we have also the DLP, QOS, Identity Awareness and HTTPS Inspection that are eating their chunk of Memory 😊) we're around 75 - 90% of memory.
Therefore, this weekend we're adding another 32Gb so we will be at 64Gb tops, so we're expecting the appliance to be around 50-70% of memory utilization, as we also intend to make use of SandBlast Blades (Threat Emulation and Extraction) by adopting Autonomous Threat Prevention.
So please do "Execute the command enabled_blades in expert mode" like @PhoneBoy asked, and not a SmarConsole screenshot.... (we have HTTPS Inspection enabled and that is not showing on License Status page!!!!!)
Bottom-line, since you enabled all that was possible, and your appliance isn't MAX out from resource perspective, I would say it's normal behavior. If you want to lower that, then disable blades that are not used, and configure/fine-tune the others and you will be at an 75% maybe. But my recommendation, would be to go ahead and MAX the memory from the appliance, and then you won't bother about that part. Plus you will be able to make use of other blades, without any resource concerns.
Thank you,
PS: that reminds me of some ticket/alert of riverbeds equipment's in our environment, being all the time at 90-95% of the memory. and my response on that, was "is there any issue with the data Optimization that RB does, if not, why we care of smth like that since the RB functions in it's parameters and there were not thresholds triggered, like the RB guys have set/defined...." The box was normal to be on 90-95% memory utilization as it's made to process data in a specific way.
PS2: it's a bit tough to say what program/blade uses what quantity of memory, since they split in multiple instances that are running in parallel, therefore the recommendation to dump the unused blades is the first one, followed by the ticking of the remaining ones.
PS3: in our case, we are getting currently to an 98% of memory utilization, when we spike 300-500K connections (in the past we got also 1MIL connections) and that was increasing memory consumption, therefore our decision to MAX our the resources, in this case memory.
Hello @gemechisd ,
So you have an Quantum 7K with (I assume as you didn't specify) 32Gb of RAM and with all the blades enabled (as you showed in the last post, and you complain that the memory is 90-95% utilized ?
I mean, what would you expect? Isn't that what's the memory there for? to be utilized ?
In our case we're having OLD 15600 in our clusters (currently at 32Gb of RAM), and with almost all the blades enabled (we're not doing VPN from the appliances, therefore IPsec VPN and Mobile Access are not active in our case, and also Content Awareness, but we have also the DLP, QOS, Identity Awareness and HTTPS Inspection that are eating their chunk of Memory 😊) we're around 75 - 90% of memory.
Therefore, this weekend we're adding another 32Gb so we will be at 64Gb tops, so we're expecting the appliance to be around 50-70% of memory utilization, as we also intend to make use of SandBlast Blades (Threat Emulation and Extraction) by adopting Autonomous Threat Prevention.
So please do "Execute the command enabled_blades in expert mode" like @PhoneBoy asked, and not a SmarConsole screenshot.... (we have HTTPS Inspection enabled and that is not showing on License Status page!!!!!)
Bottom-line, since you enabled all that was possible, and your appliance isn't MAX out from resource perspective, I would say it's normal behavior. If you want to lower that, then disable blades that are not used, and configure/fine-tune the others and you will be at an 75% maybe. But my recommendation, would be to go ahead and MAX the memory from the appliance, and then you won't bother about that part. Plus you will be able to make use of other blades, without any resource concerns.
Thank you,
PS: that reminds me of some ticket/alert of riverbeds equipment's in our environment, being all the time at 90-95% of the memory. and my response on that, was "is there any issue with the data Optimization that RB does, if not, why we care of smth like that since the RB functions in it's parameters and there were not thresholds triggered, like the RB guys have set/defined...." The box was normal to be on 90-95% memory utilization as it's made to process data in a specific way.
PS2: it's a bit tough to say what program/blade uses what quantity of memory, since they split in multiple instances that are running in parallel, therefore the recommendation to dump the unused blades is the first one, followed by the ticking of the remaining ones.
PS3: in our case, we are getting currently to an 98% of memory utilization, when we spike 300-500K connections (in the past we got also 1MIL connections) and that was increasing memory consumption, therefore our decision to MAX our the resources, in this case memory.
Hello @gemechisd ,
So you have an Quantum 7K with (I assume as you didn't specify) 32Gb of RAM and with all the blades enabled (as you showed in the last post, and you complain that the memory is 90-95% utilized ?
I mean, what would you expect? Isn't that what's the memory there for? to be utilized ?
In our case we're having OLD 15600 in our clusters (currently at 32Gb of RAM), and with almost all the blades enabled (we're not doing VPN from the appliances, therefore IPsec VPN and Mobile Access are not active in our case, and also Content Awareness, but we have also the DLP, QOS, Identity Awareness and HTTPS Inspection that are eating their chunk of Memory 😊) we're around 75 - 90% of memory.
Therefore, this weekend we're adding another 32Gb so we will be at 64Gb tops, so we're expecting the appliance to be around 50-70% of memory utilization, as we also intend to make use of SandBlast Blades (Threat Emulation and Extraction) by adopting Autonomous Threat Prevention.
So please do "Execute the command enabled_blades in expert mode" like @PhoneBoy asked, and not a SmarConsole screenshot.... (we have HTTPS Inspection enabled and that is not showing on License Status page!!!!!)
Bottom-line, since you enabled all that was possible, and your appliance isn't MAX out from resource perspective, I would say it's normal behavior. If you want to lower that, then disable blades that are not used, and configure/fine-tune the others and you will be at an 75% maybe. But my recommendation, would be to go ahead and MAX the memory from the appliance, and then you won't bother about that part. Plus you will be able to make use of other blades, without any resource concerns.
Thank you,
PS: that reminds me of some ticket/alert of riverbeds equipment's in our environment, being all the time at 90-95% of the memory. and my response on that, was "is there any issue with the data Optimization that RB does, if not, why we care of smth like that since the RB functions in it's parameters and there were not thresholds triggered, like the RB guys have set/defined...." The box was normal to be on 90-95% memory utilization as it's made to process data in a specific way.
PS2: it's a bit tough to say what program/blade uses what quantity of memory, since they split in multiple instances that are running in parallel, therefore the recommendation to dump the unused blades is the first one, followed by the ticking of the remaining ones.
PS3: in our case, we are getting currently to an 98% of memory utilization, when we spike 300-500K connections (in the past we got also 1MIL connections) and that was increasing memory consumption, therefore our decision to MAX our the resources, in this case memory.
Hello @gemechisd ,
So you have an Quantum 7K with (I assume as you didn't specify) 32Gb of RAM and with all the blades enabled (as you showed in the last post, and you complain that the memory is 90-95% utilized ?
I mean, what would you expect? Isn't that what's the memory there for? to be utilized ?
In our case we're having OLD 15600 in our clusters (currently at 32Gb of RAM), and with almost all the blades enabled (we're not doing VPN from the appliances, therefore IPsec VPN and Mobile Access are not active in our case, and also Content Awareness, but we have also the DLP, QOS, Identity Awareness and HTTPS Inspection that are eating their chunk of Memory 😊) we're around 75 - 90% of memory.
Therefore, this weekend we're adding another 32Gb so we will be at 64Gb tops, so we're expecting the appliance to be around 50-70% of memory utilization, as we also intend to make use of SandBlast Blades (Threat Emulation and Extraction) by adopting Autonomous Threat Prevention.
So please do "Execute the command enabled_blades in expert mode" like @PhoneBoy asked, and not a SmarConsole screenshot.... (we have HTTPS Inspection enabled and that is not showing on License Status page!!!!!)
Bottom-line, since you enabled all that was possible, and your appliance isn't MAX out from resource perspective, I would say it's normal behavior. If you want to lower that, then disable blades that are not used, and configure/fine-tune the others and you will be at an 75% maybe. But my recommendation, would be to go ahead and MAX the memory from the appliance, and then you won't bother about that part. Plus you will be able to make use of other blades, without any resource concerns.
Thank you,
PS: that reminds me of some ticket/alert of riverbeds equipment's in our environment, being all the time at 90-95% of the memory. and my response on that, was "is there any issue with the data Optimization that RB does, if not, why we care of smth like that since the RB functions in it's parameters and there were not thresholds triggered, like the RB guys have set/defined...." The box was normal to be on 90-95% memory utilization as it's made to process data in a specific way.
PS2: it's a bit tough to say what program/blade uses what quantity of memory, since they split in multiple instances that are running in parallel, therefore the recommendation to dump the unused blades is the first one, followed by the ticking of the remaining ones.
PS3: in our case, we are getting currently to an 98% of memory utilization, when we spike 300-500K connections (in the past we got also 1MIL connections) and that was increasing memory consumption, therefore our decision to MAX our the resources, in this case memory.
Hello @gemechisd ,
So you have an Quantum 7K with (I assume as you didn't specify) 32Gb of RAM and with all the blades enabled (as you showed in the last post, and you complain that the memory is 90-95% utilized ?
I mean, what would you expect? Isn't that what's the memory there for? to be utilized ?
In our case we're having OLD 15600 in our clusters (currently at 32Gb of RAM), and with almost all the blades enabled (we're not doing VPN from the appliances, therefore IPsec VPN and Mobile Access are not active in our case, and also Content Awareness, but we have also the DLP, QOS, Identity Awareness and HTTPS Inspection that are eating their chunk of Memory 😊) we're around 75 - 90% of memory.
Therefore, this weekend we're adding another 32Gb so we will be at 64Gb tops, so we're expecting the appliance to be around 50-70% of memory utilization, as we also intend to make use of SandBlast Blades (Threat Emulation and Extraction) by adopting Autonomous Threat Prevention.
So please do "Execute the command enabled_blades in expert mode" like @PhoneBoy asked, and not a SmarConsole screenshot.... (we have HTTPS Inspection enabled and that is not showing on License Status page!!!!!)
Bottom-line, since you enabled all that was possible, and your appliance isn't MAX out from resource perspective, I would say it's normal behavior. If you want to lower that, then disable blades that are not used, and configure/fine-tune the others and you will be at an 75% maybe. But my recommendation, would be to go ahead and MAX the memory from the appliance, and then you won't bother about that part. Plus you will be able to make use of other blades, without any resource concerns.
Thank you,
PS: that reminds me of some ticket/alert of riverbeds equipment's in our environment, being all the time at 90-95% of the memory. and my response on that, was "is there any issue with the data Optimization that RB does, if not, why we care of smth like that since the RB functions in it's parameters and there were not thresholds triggered, like the RB guys have set/defined...." The box was normal to be on 90-95% memory utilization as it's made to process data in a specific way.
PS2: it's a bit tough to say what program/blade uses what quantity of memory, since they split in multiple instances that are running in parallel, therefore the recommendation to dump the unused blades is the first one, followed by the ticking of the remaining ones.
PS3: in our case, we are getting currently to an 98% of memory utilization, when we spike 300-500K connections (in the past we got also 1MIL connections) and that was increasing memory consumption, therefore our decision to MAX our the resources, in this case memory.
Hello @gemechisd ,
So you have an Quantum 7K with (I assume as you didn't specify) 32Gb of RAM and with all the blades enabled (as you showed in the last post, and you complain that the memory is 90-95% utilized ?
I mean, what would you expect? Isn't that what's the memory there for? to be utilized ?
In our case we're having OLD 15600 in our clusters (currently at 32Gb of RAM), and with almost all the blades enabled (we're not doing VPN from the appliances, therefore IPsec VPN and Mobile Access are not active in our case, and also Content Awareness, but we have also the DLP, QOS, Identity Awareness and HTTPS Inspection that are eating their chunk of Memory 😊) we're around 75 - 90% of memory.
Therefore, this weekend we're adding another 32Gb so we will be at 64Gb tops, so we're expecting the appliance to be around 50-70% of memory utilization, as we also intend to make use of SandBlast Blades (Threat Emulation and Extraction) by adopting Autonomous Threat Prevention.
So please do "Execute the command enabled_blades in expert mode" like @PhoneBoy asked, and not a SmarConsole screenshot.... (we have HTTPS Inspection enabled and that is not showing on License Status page!!!!!)
Bottom-line, since you enabled all that was possible, and your appliance isn't MAX out from resource perspective, I would say it's normal behavior. If you want to lower that, then disable blades that are not used, and configure/fine-tune the others and you will be at an 75% maybe. But my recommendation, would be to go ahead and MAX the memory from the appliance, and then you won't bother about that part. Plus you will be able to make use of other blades, without any resource concerns.
Thank you,
PS: that reminds me of some ticket/alert of riverbeds equipment's in our environment, being all the time at 90-95% of the memory. and my response on that, was "is there any issue with the data Optimization that RB does, if not, why we care of smth like that since the RB functions in it's parameters and there were not thresholds triggered, like the RB guys have set/defined...." The box was normal to be on 90-95% memory utilization as it's made to process data in a specific way.
PS2: it's a bit tough to say what program/blade uses what quantity of memory, since they split in multiple instances that are running in parallel, therefore the recommendation to dump the unused blades is the first one, followed by the ticking of the remaining ones.
PS3: in our case, we are getting currently to an 98% of memory utilization, when we spike 300-500K connections (in the past we got also 1MIL connections) and that was increasing memory consumption, therefore our decision to MAX our the resources, in this case memory.
Hello @gemechisd ,
So you have an Quantum 7K with (I assume as you didn't specify) 32Gb of RAM and with all the blades enabled (as you showed in the last post, and you complain that the memory is 90-95% utilized ?
I mean, what would you expect? Isn't that what's the memory there for? to be utilized ?
In our case we're having OLD 15600 in our clusters (currently at 32Gb of RAM), and with almost all the blades enabled (we're not doing VPN from the appliances, therefore IPsec VPN and Mobile Access are not active in our case, and also Content Awareness, but we have also the DLP, QOS, Identity Awareness and HTTPS Inspection that are eating their chunk of Memory 😊) we're around 75 - 90% of memory.
Therefore, this weekend we're adding another 32Gb so we will be at 64Gb tops, so we're expecting the appliance to be around 50-70% of memory utilization, as we also intend to make use of SandBlast Blades (Threat Emulation and Extraction) by adopting Autonomous Threat Prevention.
So please do "Execute the command enabled_blades in expert mode" like @PhoneBoy asked, and not a SmarConsole screenshot.... (we have HTTPS Inspection enabled and that is not showing on License Status page!!!!!)
Bottom-line, since you enabled all that was possible, and your appliance isn't MAX out from resource perspective, I would say it's normal behavior. If you want to lower that, then disable blades that are not used, and configure/fine-tune the others and you will be at an 75% maybe. But my recommendation, would be to go ahead and MAX the memory from the appliance, and then you won't bother about that part. Plus you will be able to make use of other blades, without any resource concerns.
Thank you,
PS: that reminds me of some ticket/alert of riverbeds equipment's in our environment, being all the time at 90-95% of the memory. and my response on that, was "is there any issue with the data Optimization that RB does, if not, why we care of smth like that since the RB functions in it's parameters and there were not thresholds triggered, like the RB guys have set/defined...." The box was normal to be on 90-95% memory utilization as it's made to process data in a specific way.
PS2: it's a bit tough to say what program/blade uses what quantity of memory, since they split in multiple instances that are running in parallel, therefore the recommendation to dump the unused blades is the first one, followed by the ticking of the remaining ones.
PS3: in our case, we are getting currently to an 98% of memory utilization, when we spike 300-500K connections (in the past we got also 1MIL connections) and that was increasing memory consumption, therefore our decision to MAX our the resources, in this case memory.
Hello @gemechisd ,
So you have an Quantum 7K with (I assume as you didn't specify) 32Gb of RAM and with all the blades enabled (as you showed in the last post, and you complain that the memory is 90-95% utilized ?
I mean, what would you expect? Isn't that what's the memory there for? to be utilized ?
In our case we're having OLD 15600 in our clusters (currently at 32Gb of RAM), and with almost all the blades enabled (we're not doing VPN from the appliances, therefore IPsec VPN and Mobile Access are not active in our case, and also Content Awareness, but we have also the DLP, QOS, Identity Awareness and HTTPS Inspection that are eating their chunk of Memory 😊) we're around 75 - 90% of memory.
Therefore, this weekend we're adding another 32Gb so we will be at 64Gb tops, so we're expecting the appliance to be around 50-70% of memory utilization, as we also intend to make use of SandBlast Blades (Threat Emulation and Extraction) by adopting Autonomous Threat Prevention.
So please do "Execute the command enabled_blades in expert mode" like @PhoneBoy asked, and not a SmarConsole screenshot.... (we have HTTPS Inspection enabled and that is not showing on License Status page!!!!!)
Bottom-line, since you enabled all that was possible, and your appliance isn't MAX out from resource perspective, I would say it's normal behavior. If you want to lower that, then disable blades that are not used, and configure/fine-tune the others and you will be at an 75% maybe. But my recommendation, would be to go ahead and MAX the memory from the appliance, and then you won't bother about that part. Plus you will be able to make use of other blades, without any resource concerns.
Thank you,
PS: that reminds me of some ticket/alert of riverbeds equipment's in our environment, being all the time at 90-95% of the memory. and my response on that, was "is there any issue with the data Optimization that RB does, if not, why we care of smth like that since the RB functions in it's parameters and there were not thresholds triggered, like the RB guys have set/defined...." The box was normal to be on 90-95% memory utilization as it's made to process data in a specific way.
PS2: it's a bit tough to say what program/blade uses what quantity of memory, since they split in multiple instances that are running in parallel, therefore the recommendation to dump the unused blades is the first one, followed by the ticking of the remaining ones.
PS3: in our case, we are getting currently to an 98% of memory utilization, when we spike 300-500K connections (in the past we got also 1MIL connections) and that was increasing memory consumption, therefore our decision to MAX our the resources, in this case memory.
Hello @gemechisd ,
So you have an Quantum 7K with (I assume as you didn't specify) 32Gb of RAM and with all the blades enabled (as you showed in the last post, and you complain that the memory is 90-95% utilized ?
I mean, what would you expect? Isn't that what's the memory there for? to be utilized ?
In our case we're having OLD 15600 in our clusters (currently at 32Gb of RAM), and with almost all the blades enabled (we're not doing VPN from the appliances, therefore IPsec VPN and Mobile Access are not active in our case, and also Content Awareness, but we have also the DLP, QOS, Identity Awareness and HTTPS Inspection that are eating their chunk of Memory 😊) we're around 75 - 90% of memory.
Therefore, this weekend we're adding another 32Gb so we will be at 64Gb tops, so we're expecting the appliance to be around 50-70% of memory utilization, as we also intend to make use of SandBlast Blades (Threat Emulation and Extraction) by adopting Autonomous Threat Prevention.
So please do "Execute the command enabled_blades in expert mode" like @PhoneBoy asked, and not a SmarConsole screenshot.... (we have HTTPS Inspection enabled and that is not showing on License Status page!!!!!)
Bottom-line, since you enabled all that was possible, and your appliance isn't MAX out from resource perspective, I would say it's normal behavior. If you want to lower that, then disable blades that are not used, and configure/fine-tune the others and you will be at an 75% maybe. But my recommendation, would be to go ahead and MAX the memory from the appliance, and then you won't bother about that part. Plus you will be able to make use of other blades, without any resource concerns.
Thank you,
PS: that reminds me of some ticket/alert of riverbeds equipment's in our environment, being all the time at 90-95% of the memory. and my response on that, was "is there any issue with the data Optimization that RB does, if not, why we care of smth like that since the RB functions in it's parameters and there were not thresholds triggered, like the RB guys have set/defined...." The box was normal to be on 90-95% memory utilization as it's made to process data in a specific way.
PS2: it's a bit tough to say what program/blade uses what quantity of memory, since they split in multiple instances that are running in parallel, therefore the recommendation to dump the unused blades is the first one, followed by the ticking of the remaining ones.
PS3: in our case, we are getting currently to an 98% of memory utilization, when we spike 300-500K connections (in the past we got also 1MIL connections) and that was increasing memory consumption, therefore our decision to MAX our the resources, in this case memory.
Hello @gemechisd ,
So you have an Quantum 7K with (I assume as you didn't specify) 32Gb of RAM and with all the blades enabled (as you showed in the last post, and you complain that the memory is 90-95% utilized ?
I mean, what would you expect? Isn't that what's the memory there for? to be utilized ?
In our case we're having OLD 15600 in our clusters (currently at 32Gb of RAM), and with almost all the blades enabled (we're not doing VPN from the appliances, therefore IPsec VPN and Mobile Access are not active in our case, and also Content Awareness, but we have also the DLP, QOS, Identity Awareness and HTTPS Inspection that are eating their chunk of Memory 😊) we're around 75 - 90% of memory.
Therefore, this weekend we're adding another 32Gb so we will be at 64Gb tops, so we're expecting the appliance to be around 50-70% of memory utilization, as we also intend to make use of SandBlast Blades (Threat Emulation and Extraction) by adopting Autonomous Threat Prevention.
So please do "Execute the command enabled_blades in expert mode" like @PhoneBoy asked, and not a SmarConsole screenshot.... (we have HTTPS Inspection enabled and that is not showing on License Status page!!!!!)
Bottom-line, since you enabled all that was possible, and your appliance isn't MAX out from resource perspective, I would say it's normal behavior. If you want to lower that, then disable blades that are not used, and configure/fine-tune the others and you will be at an 75% maybe. But my recommendation, would be to go ahead and MAX the memory from the appliance, and then you won't bother about that part. Plus you will be able to make use of other blades, without any resource concerns.
Thank you,
PS: that reminds me of some ticket/alert of riverbeds equipment's in our environment, being all the time at 90-95% of the memory. and my response on that, was "is there any issue with the data Optimization that RB does, if not, why we care of smth like that since the RB functions in it's parameters and there were not thresholds triggered, like the RB guys have set/defined...." The box was normal to be on 90-95% memory utilization as it's made to process data in a specific way.
PS2: it's a bit tough to say what program/blade uses what quantity of memory, since they split in multiple instances that are running in parallel, therefore the recommendation to dump the unused blades is the first one, followed by the ticking of the remaining ones.
PS3: in our case, we are getting currently to an 98% of memory utilization, when we spike 300-500K connections (in the past we got also 1MIL connections) and that was increasing memory consumption, therefore our decision to MAX our the resources, in this case memory.
Hello @gemechisd ,
So you have an Quantum 7K with (I assume as you didn't specify) 32Gb of RAM and with all the blades enabled (as you showed in the last post, and you complain that the memory is 90-95% utilized ?
I mean, what would you expect? Isn't that what's the memory there for? to be utilized ?
In our case we're having OLD 15600 in our clusters (currently at 32Gb of RAM), and with almost all the blades enabled (we're not doing VPN from the appliances, therefore IPsec VPN and Mobile Access are not active in our case, and also Content Awareness, but we have also the DLP, QOS, Identity Awareness and HTTPS Inspection that are eating their chunk of Memory 😊) we're around 75 - 90% of memory.
Therefore, this weekend we're adding another 32Gb so we will be at 64Gb tops, so we're expecting the appliance to be around 50-70% of memory utilization, as we also intend to make use of SandBlast Blades (Threat Emulation and Extraction) by adopting Autonomous Threat Prevention.
So please do "Execute the command enabled_blades in expert mode" like @PhoneBoy asked, and not a SmarConsole screenshot.... (we have HTTPS Inspection enabled and that is not showing on License Status page!!!!!)
Bottom-line, since you enabled all that was possible, and your appliance isn't MAX out from resource perspective, I would say it's normal behavior. If you want to lower that, then disable blades that are not used, and configure/fine-tune the others and you will be at an 75% maybe. But my recommendation, would be to go ahead and MAX the memory from the appliance, and then you won't bother about that part. Plus you will be able to make use of other blades, without any resource concerns.
Thank you,
PS: that reminds me of some ticket/alert of riverbeds equipment's in our environment, being all the time at 90-95% of the memory. and my response on that, was "is there any issue with the data Optimization that RB does, if not, why we care of smth like that since the RB functions in it's parameters and there were not thresholds triggered, like the RB guys have set/defined...." The box was normal to be on 90-95% memory utilization as it's made to process data in a specific way.
PS2: it's a bit tough to say what program/blade uses what quantity of memory, since they split in multiple instances that are running in parallel, therefore the recommendation to dump the unused blades is the first one, followed by the ticking of the remaining ones.
PS3: in our case, we are getting currently to an 98% of memory utilization, when we spike 300-500K connections (in the past we got also 1MIL connections) and that was increasing memory consumption, therefore our decision to MAX our the resources, in this case memory.
Hello @gemechisd ,
So you have an Quantum 7K with (I assume as you didn't specify) 32Gb of RAM and with all the blades enabled (as you showed in the last post, and you complain that the memory is 90-95% utilized ?
I mean, what would you expect? Isn't that what's the memory there for? to be utilized ?
In our case we're having OLD 15600 in our clusters (currently at 32Gb of RAM), and with almost all the blades enabled (we're not doing VPN from the appliances, therefore IPsec VPN and Mobile Access are not active in our case, and also Content Awareness, but we have also the DLP, QOS, Identity Awareness and HTTPS Inspection that are eating their chunk of Memory 😊) we're around 75 - 90% of memory.
Therefore, this weekend we're adding another 32Gb so we will be at 64Gb tops, so we're expecting the appliance to be around 50-70% of memory utilization, as we also intend to make use of SandBlast Blades (Threat Emulation and Extraction) by adopting Autonomous Threat Prevention.
So please do "Execute the command enabled_blades in expert mode" like @PhoneBoy asked, and not a SmarConsole screenshot.... (we have HTTPS Inspection enabled and that is not showing on License Status page!!!!!)
Bottom-line, since you enabled all that was possible, and your appliance isn't MAX out from resource perspective, I would say it's normal behavior. If you want to lower that, then disable blades that are not used, and configure/fine-tune the others and you will be at an 75% maybe. But my recommendation, would be to go ahead and MAX the memory from the appliance, and then you won't bother about that part. Plus you will be able to make use of other blades, without any resource concerns.
Thank you,
PS: that reminds me of some ticket/alert of riverbeds equipment's in our environment, being all the time at 90-95% of the memory. and my response on that, was "is there any issue with the data Optimization that RB does, if not, why we care of smth like that since the RB functions in it's parameters and there were not thresholds triggered, like the RB guys have set/defined...." The box was normal to be on 90-95% memory utilization as it's made to process data in a specific way.
PS2: it's a bit tough to say what program/blade uses what quantity of memory, since they split in multiple instances that are running in parallel, therefore the recommendation to dump the unused blades is the first one, followed by the ticking of the remaining ones.
PS3: in our case, we are getting currently to an 98% of memory utilization, when we spike 300-500K connections (in the past we got also 1MIL connections) and that was increasing memory consumption, therefore our decision to MAX our the resources, in this case memory.
Hello @gemechisd ,
So you have an Quantum 7K with (I assume as you didn't specify) 32Gb of RAM and with all the blades enabled (as you showed in the last post, and you complain that the memory is 90-95% utilized ?
I mean, what would you expect? Isn't that what's the memory there for? to be utilized ?
In our case we're having OLD 15600 in our clusters (currently at 32Gb of RAM), and with almost all the blades enabled (we're not doing VPN from the appliances, therefore IPsec VPN and Mobile Access are not active in our case, and also Content Awareness, but we have also the DLP, QOS, Identity Awareness and HTTPS Inspection that are eating their chunk of Memory 😊) we're around 75 - 90% of memory.
Therefore, this weekend we're adding another 32Gb so we will be at 64Gb tops, so we're expecting the appliance to be around 50-70% of memory utilization, as we also intend to make use of SandBlast Blades (Threat Emulation and Extraction) by adopting Autonomous Threat Prevention.
So please do "Execute the command enabled_blades in expert mode" like @PhoneBoy asked, and not a SmarConsole screenshot.... (we have HTTPS Inspection enabled and that is not showing on License Status page!!!!!)
Bottom-line, since you enabled all that was possible, and your appliance isn't MAX out from resource perspective, I would say it's normal behavior. If you want to lower that, then disable blades that are not used, and configure/fine-tune the others and you will be at an 75% maybe. But my recommendation, would be to go ahead and MAX the memory from the appliance, and then you won't bother about that part. Plus you will be able to make use of other blades, without any resource concerns.
Thank you,
PS: that reminds me of some ticket/alert of riverbeds equipment's in our environment, being all the time at 90-95% of the memory. and my response on that, was "is there any issue with the data Optimization that RB does, if not, why we care of smth like that since the RB functions in it's parameters and there were not thresholds triggered, like the RB guys have set/defined...." The box was normal to be on 90-95% memory utilization as it's made to process data in a specific way.
PS2: it's a bit tough to say what program/blade uses what quantity of memory, since they split in multiple instances that are running in parallel, therefore the recommendation to dump the unused blades is the first one, followed by the ticking of the remaining ones.
PS3: in our case, we are getting currently to an 98% of memory utilization, when we spike 300-500K connections (in the past we got also 1MIL connections) and that was increasing memory consumption, therefore our decision to MAX our the resources, in this case memory.
Hello @gemechisd ,
So you have an Quantum 7K with (I assume as you didn't specify) 32Gb of RAM and with all the blades enabled (as you showed in the last post, and you complain that the memory is 90-95% utilized ?
I mean, what would you expect? Isn't that what's the memory there for? to be utilized ?
In our case we're having OLD 15600 in our clusters (currently at 32Gb of RAM), and with almost all the blades enabled (we're not doing VPN from the appliances, therefore IPsec VPN and Mobile Access are not active in our case, and also Content Awareness, but we have also the DLP, QOS, Identity Awareness and HTTPS Inspection that are eating their chunk of Memory 😊) we're around 75 - 90% of memory.
Therefore, this weekend we're adding another 32Gb so we will be at 64Gb tops, so we're expecting the appliance to be around 50-70% of memory utilization, as we also intend to make use of SandBlast Blades (Threat Emulation and Extraction) by adopting Autonomous Threat Prevention.
So please do "Execute the command enabled_blades in expert mode" like @PhoneBoy asked, and not a SmarConsole screenshot.... (we have HTTPS Inspection enabled and that is not showing on License Status page!!!!!)
Bottom-line, since you enabled all that was possible, and your appliance isn't MAX out from resource perspective, I would say it's normal behavior. If you want to lower that, then disable blades that are not used, and configure/fine-tune the others and you will be at an 75% maybe. But my recommendation, would be to go ahead and MAX the memory from the appliance, and then you won't bother about that part. Plus you will be able to make use of other blades, without any resource concerns.
Thank you,
PS: that reminds me of some ticket/alert of riverbeds equipment's in our environment, being all the time at 90-95% of the memory. and my response on that, was "is there any issue with the data Optimization that RB does, if not, why we care of smth like that since the RB functions in it's parameters and there were not thresholds triggered, like the RB guys have set/defined...." The box was normal to be on 90-95% memory utilization as it's made to process data in a specific way.
PS2: it's a bit tough to say what program/blade uses what quantity of memory, since they split in multiple instances that are running in parallel, therefore the recommendation to dump the unused blades is the first one, followed by the ticking of the remaining ones.
PS3: in our case, we are getting currently to an 98% of memory utilization, when we spike 300-500K connections (in the past we got also 1MIL connections) and that was increasing memory consumption, therefore our decision to MAX our the resources, in this case memory.
Hello @gemechisd ,
So you have an Quantum 7K with (I assume as you didn't specify) 32Gb of RAM and with all the blades enabled (as you showed in the last post, and you complain that the memory is 90-95% utilized ?
I mean, what would you expect? Isn't that what's the memory there for? to be utilized ?
In our case we're having OLD 15600 in our clusters (currently at 32Gb of RAM), and with almost all the blades enabled (we're not doing VPN from the appliances, therefore IPsec VPN and Mobile Access are not active in our case, and also Content Awareness, but we have also the DLP, QOS, Identity Awareness and HTTPS Inspection that are eating their chunk of Memory 😊) we're around 75 - 90% of memory.
Therefore, this weekend we're adding another 32Gb so we will be at 64Gb tops, so we're expecting the appliance to be around 50-70% of memory utilization, as we also intend to make use of SandBlast Blades (Threat Emulation and Extraction) by adopting Autonomous Threat Prevention.
So please do "Execute the command enabled_blades in expert mode" like @PhoneBoy asked, and not a SmarConsole screenshot.... (we have HTTPS Inspection enabled and that is not showing on License Status page!!!!!)
Bottom-line, since you enabled all that was possible, and your appliance isn't MAX out from resource perspective, I would say it's normal behavior. If you want to lower that, then disable blades that are not used, and configure/fine-tune the others and you will be at an 75% maybe. But my recommendation, would be to go ahead and MAX the memory from the appliance, and then you won't bother about that part. Plus you will be able to make use of other blades, without any resource concerns.
Thank you,
PS: that reminds me of some ticket/alert of riverbeds equipment's in our environment, being all the time at 90-95% of the memory. and my response on that, was "is there any issue with the data Optimization that RB does, if not, why we care of smth like that since the RB functions in it's parameters and there were not thresholds triggered, like the RB guys have set/defined...." The box was normal to be on 90-95% memory utilization as it's made to process data in a specific way.
PS2: it's a bit tough to say what program/blade uses what quantity of memory, since they split in multiple instances that are running in parallel, therefore the recommendation to dump the unused blades is the first one, followed by the ticking of the remaining ones.
PS3: in our case, we are getting currently to an 98% of memory utilization, when we spike 300-500K connections (in the past we got also 1MIL connections) and that was increasing memory consumption, therefore our decision to MAX our the resources, in this case memory.
Hello @gemechisd ,
So you have an Quantum 7K with (I assume as you didn't specify) 32Gb of RAM and with all the blades enabled (as you showed in the last post, and you complain that the memory is 90-95% utilized ?
I mean, what would you expect? Isn't that what's the memory there for? to be utilized ?
In our case we're having OLD 15600 in our clusters (currently at 32Gb of RAM), and with almost all the blades enabled (we're not doing VPN from the appliances, therefore IPsec VPN and Mobile Access are not active in our case, and also Content Awareness, but we have also the DLP, QOS, Identity Awareness and HTTPS Inspection that are eating their chunk of Memory 😊) we're around 75 - 90% of memory.
Therefore, this weekend we're adding another 32Gb so we will be at 64Gb tops, so we're expecting the appliance to be around 50-70% of memory utilization, as we also intend to make use of SandBlast Blades (Threat Emulation and Extraction) by adopting Autonomous Threat Prevention.
So please do "Execute the command enabled_blades in expert mode" like @PhoneBoy asked, and not a SmarConsole screenshot.... (we have HTTPS Inspection enabled and that is not showing on License Status page!!!!!)
Bottom-line, since you enabled all that was possible, and your appliance isn't MAX out from resource perspective, I would say it's normal behavior. If you want to lower that, then disable blades that are not used, and configure/fine-tune the others and you will be at an 75% maybe. But my recommendation, would be to go ahead and MAX the memory from the appliance, and then you won't bother about that part. Plus you will be able to make use of other blades, without any resource concerns.
Thank you,
PS: that reminds me of some ticket/alert of riverbeds equipment's in our environment, being all the time at 90-95% of the memory. and my response on that, was "is there any issue with the data Optimization that RB does, if not, why we care of smth like that since the RB functions in it's parameters and there were not thresholds triggered, like the RB guys have set/defined...." The box was normal to be on 90-95% memory utilization as it's made to process data in a specific way.
PS2: it's a bit tough to say what program/blade uses what quantity of memory, since they split in multiple instances that are running in parallel, therefore the recommendation to dump the unused blades is the first one, followed by the ticking of the remaining ones.
PS3: in our case, we are getting currently to an 98% of memory utilization, when we spike 300-500K connections (in the past we got also 1MIL connections) and that was increasing memory consumption, therefore our decision to MAX our the resources, in this case memory.
Hello @gemechisd ,
So you have an Quantum 7K with (I assume as you didn't specify) 32Gb of RAM and with all the blades enabled (as you showed in the last post, and you complain that the memory is 90-95% utilized ?
I mean, what would you expect? Isn't that what's the memory there for? to be utilized ?
In our case we're having OLD 15600 in our clusters (currently at 32Gb of RAM), and with almost all the blades enabled (we're not doing VPN from the appliances, therefore IPsec VPN and Mobile Access are not active in our case, and also Content Awareness, but we have also the DLP, QOS, Identity Awareness and HTTPS Inspection that are eating their chunk of Memory 😊) we're around 75 - 90% of memory.
Therefore, this weekend we're adding another 32Gb so we will be at 64Gb tops, so we're expecting the appliance to be around 50-70% of memory utilization, as we also intend to make use of SandBlast Blades (Threat Emulation and Extraction) by adopting Autonomous Threat Prevention.
So please do "Execute the command enabled_blades in expert mode" like @PhoneBoy asked, and not a SmarConsole screenshot.... (we have HTTPS Inspection enabled and that is not showing on License Status page!!!!!)
Bottom-line, since you enabled all that was possible, and your appliance isn't MAX out from resource perspective, I would say it's normal behavior. If you want to lower that, then disable blades that are not used, and configure/fine-tune the others and you will be at an 75% maybe. But my recommendation, would be to go ahead and MAX the memory from the appliance, and then you won't bother about that part. Plus you will be able to make use of other blades, without any resource concerns.
Thank you,
PS: that reminds me of some ticket/alert of riverbeds equipment's in our environment, being all the time at 90-95% of the memory. and my response on that, was "is there any issue with the data Optimization that RB does, if not, why we care of smth like that since the RB functions in it's parameters and there were not thresholds triggered, like the RB guys have set/defined...." The box was normal to be on 90-95% memory utilization as it's made to process data in a specific way.
PS2: it's a bit tough to say what program/blade uses what quantity of memory, since they split in multiple instances that are running in parallel, therefore the recommendation to dump the unused blades is the first one, followed by the ticking of the remaining ones.
PS3: in our case, we are getting currently to an 98% of memory utilization, when we spike 300-500K connections (in the past we got also 1MIL connections) and that was increasing memory consumption, therefore our decision to MAX our the resources, in this case memory.
Hello @gemechisd ,
So you have an Quantum 7K with (I assume as you didn't specify) 32Gb of RAM and with all the blades enabled (as you showed in the last post, and you complain that the memory is 90-95% utilized ?
I mean, what would you expect? Isn't that what's the memory there for? to be utilized ?
In our case we're having OLD 15600 in our clusters (currently at 32Gb of RAM), and with almost all the blades enabled (we're not doing VPN from the appliances, therefore IPsec VPN and Mobile Access are not active in our case, and also Content Awareness, but we have also the DLP, QOS, Identity Awareness and HTTPS Inspection that are eating their chunk of Memory 😊) we're around 75 - 90% of memory.
Therefore, this weekend we're adding another 32Gb so we will be at 64Gb tops, so we're expecting the appliance to be around 50-70% of memory utilization, as we also intend to make use of SandBlast Blades (Threat Emulation and Extraction) by adopting Autonomous Threat Prevention.
So please do "Execute the command enabled_blades in expert mode" like @PhoneBoy asked, and not a SmarConsole screenshot.... (we have HTTPS Inspection enabled and that is not showing on License Status page!!!!!)
Bottom-line, since you enabled all that was possible, and your appliance isn't MAX out from resource perspective, I would say it's normal behavior. If you want to lower that, then disable blades that are not used, and configure/fine-tune the others and you will be at an 75% maybe. But my recommendation, would be to go ahead and MAX the memory from the appliance, and then you won't bother about that part. Plus you will be able to make use of other blades, without any resource concerns.
Thank you,
PS: that reminds me of some ticket/alert of riverbeds equipment's in our environment, being all the time at 90-95% of the memory. and my response on that, was "is there any issue with the data Optimization that RB does, if not, why we care of smth like that since the RB functions in it's parameters and there were not thresholds triggered, like the RB guys have set/defined...." The box was normal to be on 90-95% memory utilization as it's made to process data in a specific way.
PS2: it's a bit tough to say what program/blade uses what quantity of memory, since they split in multiple instances that are running in parallel, therefore the recommendation to dump the unused blades is the first one, followed by the ticking of the remaining ones.
PS3: in our case, we are getting currently to an 98% of memory utilization, when we spike 300-500K connections (in the past we got also 1MIL connections) and that was increasing memory consumption, therefore our decision to MAX our the resources, in this case memory.

@Sorin_Gogean
Yeah we have 7K appliance with 32GB RAM.
But the memory utilization is increasing before 2 weeks. And after that we were not able to see any logs on our SMS. I will do the enabled_blades command and see if there is anything new/I'll share it.
@Sorin_Gogean
Yeah we have 7K appliance with 32GB RAM.
But the memory utilization is increasing before 2 weeks. And after that we were not able to see any logs on our SMS. I will do the enabled_blades command and see if there is anything new/I'll share it.
@Sorin_Gogean
Yeah we have 7K appliance with 32GB RAM.
But the memory utilization is increasing before 2 weeks. And after that we were not able to see any logs on our SMS. I will do the enabled_blades command and see if there is anything new/I'll share it.
@Sorin_Gogean
Yeah we have 7K appliance with 32GB RAM.
But the memory utilization is increasing before 2 weeks. And after that we were not able to see any logs on our SMS. I will do the enabled_blades command and see if there is anything new/I'll share it.
@Sorin_Gogean
Yeah we have 7K appliance with 32GB RAM.
But the memory utilization is increasing before 2 weeks. And after that we were not able to see any logs on our SMS. I will do the enabled_blades command and see if there is anything new/I'll share it.
@Sorin_Gogean
Yeah we have 7K appliance with 32GB RAM.
But the memory utilization is increasing before 2 weeks. And after that we were not able to see any logs on our SMS. I will do the enabled_blades command and see if there is anything new/I'll share it.
@Sorin_Gogean
Yeah we have 7K appliance with 32GB RAM.
But the memory utilization is increasing before 2 weeks. And after that we were not able to see any logs on our SMS. I will do the enabled_blades command and see if there is anything new/I'll share it.
@Sorin_Gogean
Yeah we have 7K appliance with 32GB RAM.
But the memory utilization is increasing before 2 weeks. And after that we were not able to see any logs on our SMS. I will do the enabled_blades command and see if there is anything new/I'll share it.
@Sorin_Gogean
Yeah we have 7K appliance with 32GB RAM.
But the memory utilization is increasing before 2 weeks. And after that we were not able to see any logs on our SMS. I will do the enabled_blades command and see if there is anything new/I'll share it.
@Sorin_Gogean
Yeah we have 7K appliance with 32GB RAM.
But the memory utilization is increasing before 2 weeks. And after that we were not able to see any logs on our SMS. I will do the enabled_blades command and see if there is anything new/I'll share it.
@Sorin_Gogean
Yeah we have 7K appliance with 32GB RAM.
But the memory utilization is increasing before 2 weeks. And after that we were not able to see any logs on our SMS. I will do the enabled_blades command and see if there is anything new/I'll share it.
@Sorin_Gogean
Yeah we have 7K appliance with 32GB RAM.
But the memory utilization is increasing before 2 weeks. And after that we were not able to see any logs on our SMS. I will do the enabled_blades command and see if there is anything new/I'll share it.
@Sorin_Gogean
Yeah we have 7K appliance with 32GB RAM.
But the memory utilization is increasing before 2 weeks. And after that we were not able to see any logs on our SMS. I will do the enabled_blades command and see if there is anything new/I'll share it.
@Sorin_Gogean
Yeah we have 7K appliance with 32GB RAM.
But the memory utilization is increasing before 2 weeks. And after that we were not able to see any logs on our SMS. I will do the enabled_blades command and see if there is anything new/I'll share it.
@Sorin_Gogean
Yeah we have 7K appliance with 32GB RAM.
But the memory utilization is increasing before 2 weeks. And after that we were not able to see any logs on our SMS. I will do the enabled_blades command and see if there is anything new/I'll share it.
@Sorin_Gogean
Yeah we have 7K appliance with 32GB RAM.
But the memory utilization is increasing before 2 weeks. And after that we were not able to see any logs on our SMS. I will do the enabled_blades command and see if there is anything new/I'll share it.
@Sorin_Gogean
Yeah we have 7K appliance with 32GB RAM.
But the memory utilization is increasing before 2 weeks. And after that we were not able to see any logs on our SMS. I will do the enabled_blades command and see if there is anything new/I'll share it.
@Sorin_Gogean
Yeah we have 7K appliance with 32GB RAM.
But the memory utilization is increasing before 2 weeks. And after that we were not able to see any logs on our SMS. I will do the enabled_blades command and see if there is anything new/I'll share it.
@Sorin_Gogean
Yeah we have 7K appliance with 32GB RAM.
But the memory utilization is increasing before 2 weeks. And after that we were not able to see any logs on our SMS. I will do the enabled_blades command and see if there is anything new/I'll share it.
@Sorin_Gogean
Yeah we have 7K appliance with 32GB RAM.
But the memory utilization is increasing before 2 weeks. And after that we were not able to see any logs on our SMS. I will do the enabled_blades command and see if there is anything new/I'll share it.
@Sorin_Gogean
Yeah we have 7K appliance with 32GB RAM.
But the memory utilization is increasing before 2 weeks. And after that we were not able to see any logs on our SMS. I will do the enabled_blades command and see if there is anything new/I'll share it.
So, you're saying that you see memory increase in last 2 weeks, or after an appliance restart, as soon as we put traffic through it, in 2 weeks time we're seeing an increase of memory ?
Also in regards to the missing logs, is this used as a Management also or you have a separate management/log server or appliance ?
As for the blades, can you tell what are you actually using, or you are unaware as you just enable all possible ones and didn't configure half of them...
Ty,
PS: I really can't understand why you're not presenting all the things from the beginning, in order for us to know your environment, and point you properly 🙄.
So, you're saying that you see memory increase in last 2 weeks, or after an appliance restart, as soon as we put traffic through it, in 2 weeks time we're seeing an increase of memory ?
Also in regards to the missing logs, is this used as a Management also or you have a separate management/log server or appliance ?
As for the blades, can you tell what are you actually using, or you are unaware as you just enable all possible ones and didn't configure half of them...
Ty,
PS: I really can't understand why you're not presenting all the things from the beginning, in order for us to know your environment, and point you properly 🙄.
So, you're saying that you see memory increase in last 2 weeks, or after an appliance restart, as soon as we put traffic through it, in 2 weeks time we're seeing an increase of memory ?
Also in regards to the missing logs, is this used as a Management also or you have a separate management/log server or appliance ?
As for the blades, can you tell what are you actually using, or you are unaware as you just enable all possible ones and didn't configure half of them...
Ty,
PS: I really can't understand why you're not presenting all the things from the beginning, in order for us to know your environment, and point you properly 🙄.
So, you're saying that you see memory increase in last 2 weeks, or after an appliance restart, as soon as we put traffic through it, in 2 weeks time we're seeing an increase of memory ?
Also in regards to the missing logs, is this used as a Management also or you have a separate management/log server or appliance ?
As for the blades, can you tell what are you actually using, or you are unaware as you just enable all possible ones and didn't configure half of them...
Ty,
PS: I really can't understand why you're not presenting all the things from the beginning, in order for us to know your environment, and point you properly 🙄.
So, you're saying that you see memory increase in last 2 weeks, or after an appliance restart, as soon as we put traffic through it, in 2 weeks time we're seeing an increase of memory ?
Also in regards to the missing logs, is this used as a Management also or you have a separate management/log server or appliance ?
As for the blades, can you tell what are you actually using, or you are unaware as you just enable all possible ones and didn't configure half of them...
Ty,
PS: I really can't understand why you're not presenting all the things from the beginning, in order for us to know your environment, and point you properly 🙄.
So, you're saying that you see memory increase in last 2 weeks, or after an appliance restart, as soon as we put traffic through it, in 2 weeks time we're seeing an increase of memory ?
Also in regards to the missing logs, is this used as a Management also or you have a separate management/log server or appliance ?
As for the blades, can you tell what are you actually using, or you are unaware as you just enable all possible ones and didn't configure half of them...
Ty,
PS: I really can't understand why you're not presenting all the things from the beginning, in order for us to know your environment, and point you properly 🙄.
So, you're saying that you see memory increase in last 2 weeks, or after an appliance restart, as soon as we put traffic through it, in 2 weeks time we're seeing an increase of memory ?
Also in regards to the missing logs, is this used as a Management also or you have a separate management/log server or appliance ?
As for the blades, can you tell what are you actually using, or you are unaware as you just enable all possible ones and didn't configure half of them...
Ty,
PS: I really can't understand why you're not presenting all the things from the beginning, in order for us to know your environment, and point you properly 🙄.
So, you're saying that you see memory increase in last 2 weeks, or after an appliance restart, as soon as we put traffic through it, in 2 weeks time we're seeing an increase of memory ?
Also in regards to the missing logs, is this used as a Management also or you have a separate management/log server or appliance ?
As for the blades, can you tell what are you actually using, or you are unaware as you just enable all possible ones and didn't configure half of them...
Ty,
PS: I really can't understand why you're not presenting all the things from the beginning, in order for us to know your environment, and point you properly 🙄.
So, you're saying that you see memory increase in last 2 weeks, or after an appliance restart, as soon as we put traffic through it, in 2 weeks time we're seeing an increase of memory ?
Also in regards to the missing logs, is this used as a Management also or you have a separate management/log server or appliance ?
As for the blades, can you tell what are you actually using, or you are unaware as you just enable all possible ones and didn't configure half of them...
Ty,
PS: I really can't understand why you're not presenting all the things from the beginning, in order for us to know your environment, and point you properly 🙄.
So, you're saying that you see memory increase in last 2 weeks, or after an appliance restart, as soon as we put traffic through it, in 2 weeks time we're seeing an increase of memory ?
Also in regards to the missing logs, is this used as a Management also or you have a separate management/log server or appliance ?
As for the blades, can you tell what are you actually using, or you are unaware as you just enable all possible ones and didn't configure half of them...
Ty,
PS: I really can't understand why you're not presenting all the things from the beginning, in order for us to know your environment, and point you properly 🙄.
So, you're saying that you see memory increase in last 2 weeks, or after an appliance restart, as soon as we put traffic through it, in 2 weeks time we're seeing an increase of memory ?
Also in regards to the missing logs, is this used as a Management also or you have a separate management/log server or appliance ?
As for the blades, can you tell what are you actually using, or you are unaware as you just enable all possible ones and didn't configure half of them...
Ty,
PS: I really can't understand why you're not presenting all the things from the beginning, in order for us to know your environment, and point you properly 🙄.
So, you're saying that you see memory increase in last 2 weeks, or after an appliance restart, as soon as we put traffic through it, in 2 weeks time we're seeing an increase of memory ?
Also in regards to the missing logs, is this used as a Management also or you have a separate management/log server or appliance ?
As for the blades, can you tell what are you actually using, or you are unaware as you just enable all possible ones and didn't configure half of them...
Ty,
PS: I really can't understand why you're not presenting all the things from the beginning, in order for us to know your environment, and point you properly 🙄.
So, you're saying that you see memory increase in last 2 weeks, or after an appliance restart, as soon as we put traffic through it, in 2 weeks time we're seeing an increase of memory ?
Also in regards to the missing logs, is this used as a Management also or you have a separate management/log server or appliance ?
As for the blades, can you tell what are you actually using, or you are unaware as you just enable all possible ones and didn't configure half of them...
Ty,
PS: I really can't understand why you're not presenting all the things from the beginning, in order for us to know your environment, and point you properly 🙄.
So, you're saying that you see memory increase in last 2 weeks, or after an appliance restart, as soon as we put traffic through it, in 2 weeks time we're seeing an increase of memory ?
Also in regards to the missing logs, is this used as a Management also or you have a separate management/log server or appliance ?
As for the blades, can you tell what are you actually using, or you are unaware as you just enable all possible ones and didn't configure half of them...
Ty,
PS: I really can't understand why you're not presenting all the things from the beginning, in order for us to know your environment, and point you properly 🙄.
So, you're saying that you see memory increase in last 2 weeks, or after an appliance restart, as soon as we put traffic through it, in 2 weeks time we're seeing an increase of memory ?
Also in regards to the missing logs, is this used as a Management also or you have a separate management/log server or appliance ?
As for the blades, can you tell what are you actually using, or you are unaware as you just enable all possible ones and didn't configure half of them...
Ty,
PS: I really can't understand why you're not presenting all the things from the beginning, in order for us to know your environment, and point you properly 🙄.
So, you're saying that you see memory increase in last 2 weeks, or after an appliance restart, as soon as we put traffic through it, in 2 weeks time we're seeing an increase of memory ?
Also in regards to the missing logs, is this used as a Management also or you have a separate management/log server or appliance ?
As for the blades, can you tell what are you actually using, or you are unaware as you just enable all possible ones and didn't configure half of them...
Ty,
PS: I really can't understand why you're not presenting all the things from the beginning, in order for us to know your environment, and point you properly 🙄.
So, you're saying that you see memory increase in last 2 weeks, or after an appliance restart, as soon as we put traffic through it, in 2 weeks time we're seeing an increase of memory ?
Also in regards to the missing logs, is this used as a Management also or you have a separate management/log server or appliance ?
As for the blades, can you tell what are you actually using, or you are unaware as you just enable all possible ones and didn't configure half of them...
Ty,
PS: I really can't understand why you're not presenting all the things from the beginning, in order for us to know your environment, and point you properly 🙄.
So, you're saying that you see memory increase in last 2 weeks, or after an appliance restart, as soon as we put traffic through it, in 2 weeks time we're seeing an increase of memory ?
Also in regards to the missing logs, is this used as a Management also or you have a separate management/log server or appliance ?
As for the blades, can you tell what are you actually using, or you are unaware as you just enable all possible ones and didn't configure half of them...
Ty,
PS: I really can't understand why you're not presenting all the things from the beginning, in order for us to know your environment, and point you properly 🙄.
So, you're saying that you see memory increase in last 2 weeks, or after an appliance restart, as soon as we put traffic through it, in 2 weeks time we're seeing an increase of memory ?
Also in regards to the missing logs, is this used as a Management also or you have a separate management/log server or appliance ?
As for the blades, can you tell what are you actually using, or you are unaware as you just enable all possible ones and didn't configure half of them...
Ty,
PS: I really can't understand why you're not presenting all the things from the beginning, in order for us to know your environment, and point you properly 🙄.
So, you're saying that you see memory increase in last 2 weeks, or after an appliance restart, as soon as we put traffic through it, in 2 weeks time we're seeing an increase of memory ?
Also in regards to the missing logs, is this used as a Management also or you have a separate management/log server or appliance ?
As for the blades, can you tell what are you actually using, or you are unaware as you just enable all possible ones and didn't configure half of them...
Ty,
PS: I really can't understand why you're not presenting all the things from the beginning, in order for us to know your environment, and point you properly 🙄.
So, you're saying that you see memory increase in last 2 weeks, or after an appliance restart, as soon as we put traffic through it, in 2 weeks time we're seeing an increase of memory ?
Also in regards to the missing logs, is this used as a Management also or you have a separate management/log server or appliance ?
As for the blades, can you tell what are you actually using, or you are unaware as you just enable all possible ones and didn't configure half of them...
Ty,
PS: I really can't understand why you're not presenting all the things from the beginning, in order for us to know your environment, and point you properly 🙄.