
- Products
- Learn
- Local User Groups
- Partners
- More

What's New in R82.10?
10 December @ 5pm CET / 11am ET
Improve Your Security Posture with
Threat Prevention and Policy Insights
Overlap in Security Validation
Help us to understand your needs better
CheckMates Go:
Maestro Madness
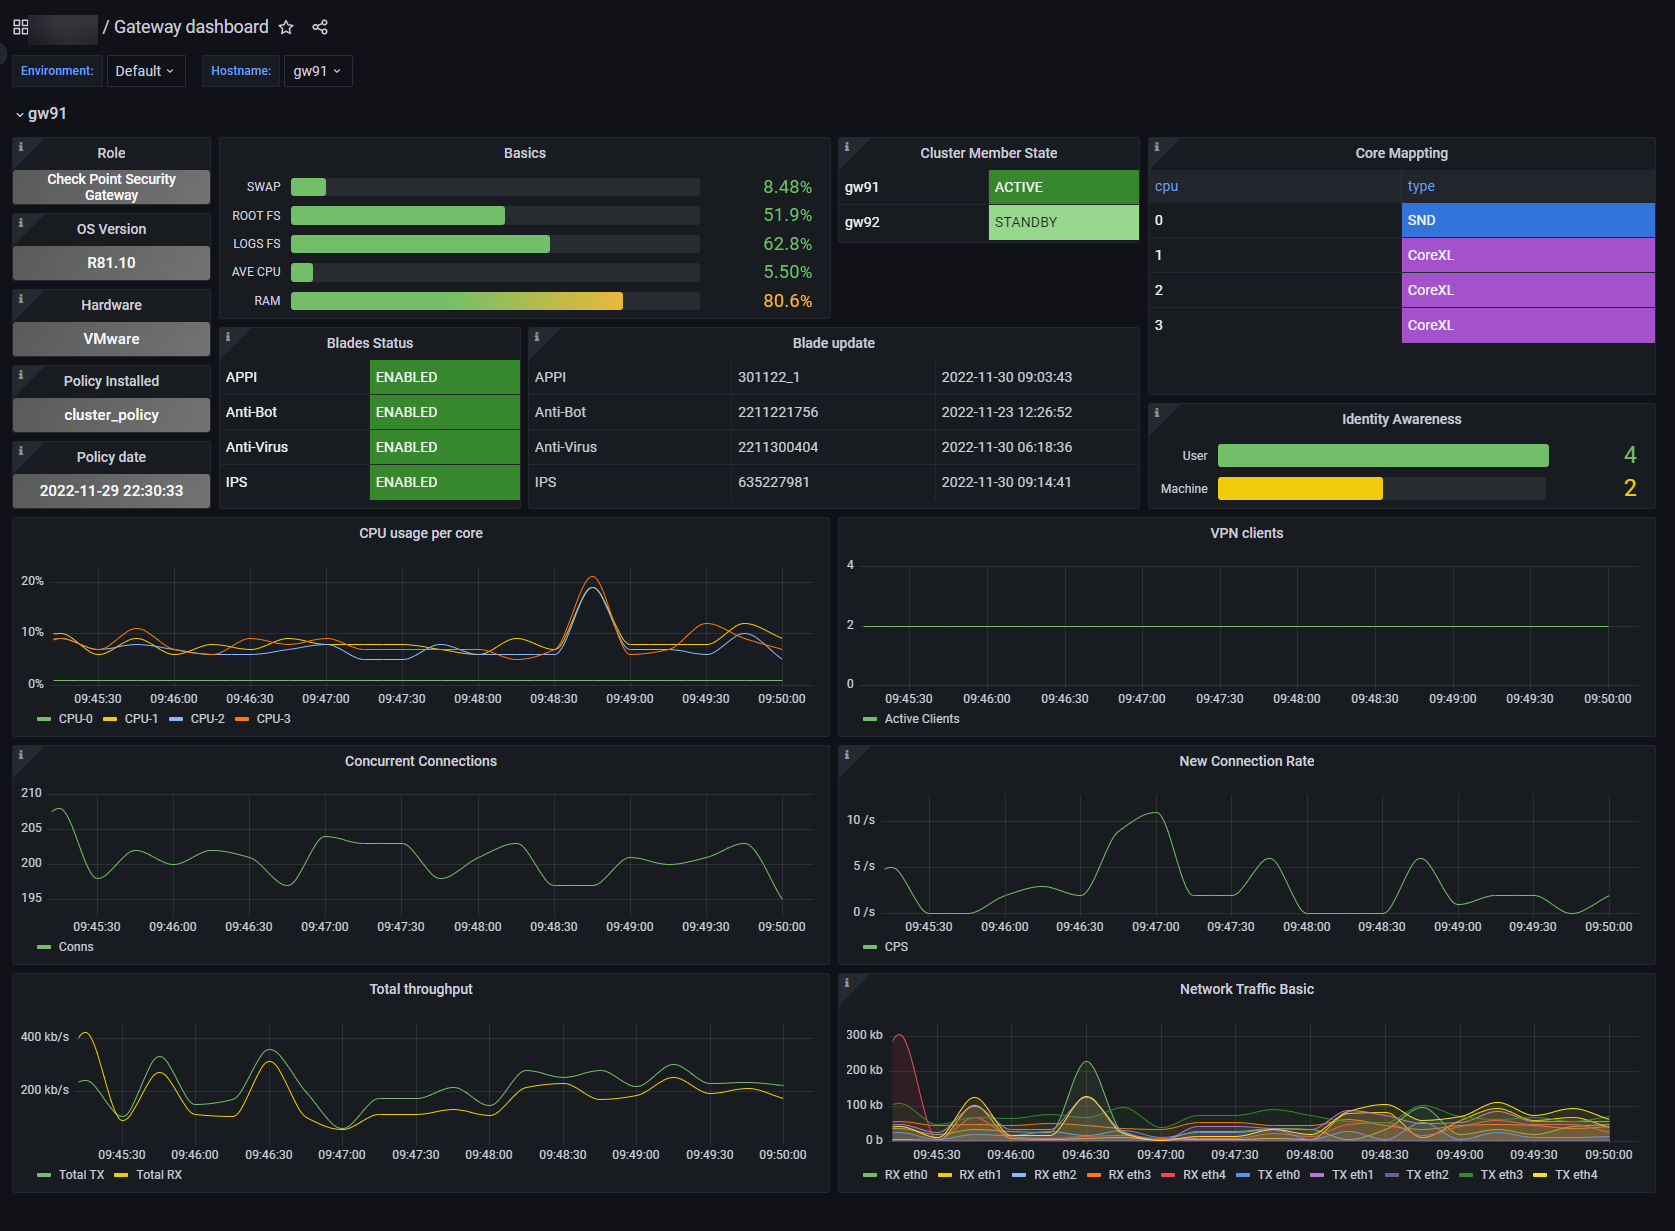
Here's another alternative for Skyline cluster dashboard that has:
Here's another alternative for Skyline cluster dashboard that has:
Thank you very much.
Like the Dashboard. Shows relevant information like concurrent conns, connection rate, VPN Users and single CPU performance graph. Let's you identify if some CPUs have 100% or not.
Missing the "Packets per second" graph. Need to check if I can add this on my own because I am not so familar with Grafana.
So I appreciate this provided dashboard!
Thanks for the Dashboard.
There is a bug in "Blades Status". Your host_name is hardcoded
$ jq '.["panels"][7]["targets"][0]["expr"]' <Gateway-dashboard-KZ.json
"blades_update_state{host_name=~\"gw91\", environment=~\"Default\"}"
About CheckMates
Learn Check Point
Advanced Learning
YOU DESERVE THE BEST SECURITY