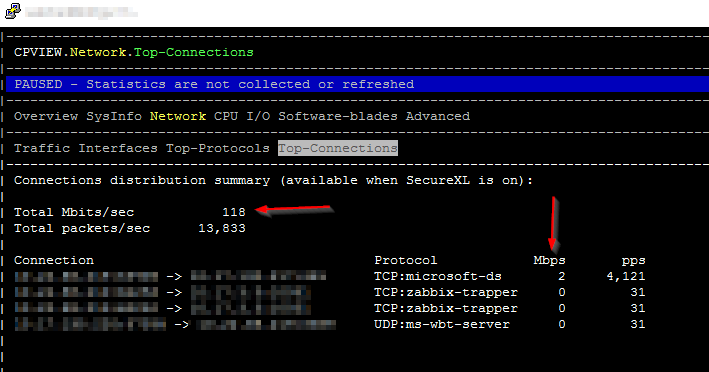
SecureXL is on. I now also enabled NAT templates and rebooted.
Here are the mentioned outputs (from past the reboot)
[Expert@xx:0]# fw ctl pstat
System Capacity Summary:
Memory used: 14% (828 MB out of 5784 MB) - below watermark
Concurrent Connections: 213 (Unlimited)
Aggressive Aging is enabled, not active
Hash kernel memory (hmem) statistics:
Total memory allocated: 603979776 bytes in 147456 (4096 bytes) blocks using 1 pool
Total memory bytes used: 0 unused: 603979776 (100.00%) peak: 197387556
Total memory blocks used: 0 unused: 147456 (100%) peak: 49939
Allocations: 5294012 alloc, 0 failed alloc, 3001851 free
System kernel memory (smem) statistics:
Total memory bytes used: 1139453984 peak: 1139526016
Total memory bytes wasted: 4489422
Blocking memory bytes used: 3749884 peak: 3795104
Non-Blocking memory bytes used: 1135704100 peak: 1135730912
Allocations: 9246 alloc, 0 failed alloc, 5122 free, 0 failed free
vmalloc bytes used: 1129724604 expensive: no
Kernel memory (kmem) statistics:
Total memory bytes used: 710079912 peak: 721669260
Allocations: 5301716 alloc, 0 failed alloc
3006895 free, 0 failed free
External Allocations: 0 for packets, 78901261 for SXL
Cookies:
502084 total, 0 alloc, 0 free,
0 dup, 2594867 get, 407415 put,
838803 len, 0 cached len, 0 chain alloc,
0 chain free
Connections:
1992 total, 543 TCP, 1401 UDP, 48 ICMP,
0 other, 0 anticipated, 0 recovered, 213 concurrent,
1484 peak concurrent
Fragments:
0 fragments, 0 packets, 0 expired, 0 short,
0 large, 0 duplicates, 0 failures
NAT:
4/0 forw, 0/0 bckw, 4 tcpudp,
0 icmp, 4-2 alloc
Sync: off
[Expert@xx:0]# fwaccel stats | grep "C total conns"
C total conns 197 C templates 1
[Expert@xx:0]# fw tab -t connections -s
HOST NAME ID #VALS #PEAK #SLINKS
localhost connections 8158 202 1270 476


