Create a Post
cancel
Showing results for 
Search instead for 
Did you mean: 
israelsc
Contributor

I don't see information in SmartEvent reports - Firewall Bridge Mode

Hello everyone!

I have an issue with some SmartEvent reports on a firewall that is operating in bridge mode, in standalone operation mode and with R81.10 JHF 79 GA.

The model of the firewall is a 5600 which basically has the following on its interfaces:
*Mmgt interface - for firewall management.
*Bridge interface composed by interface eth1 (for inbound traffic) and eth2 (for outbound traffic) [defining eth1 as internal interface and eth2 as external interface in anti-spoofing].
The source traffic comes from a corporate office and sends the traffic to a Backup as a Service provider, this is the traffic that passes through the bridge interfaces. Basically a bridge for a "LAN" type network.

I am trying to generate some SmartEvent reports such as "Network Activity", "Threat Prevention" or any other type of report, however when I put the report for the last 7 days, 24 hours or any time range, the reports do not contain any information and generate empty reports.

In the firewall I have the Monitoring (advanced networking) blades, SmartEvent Server, SmartEvent Correlation Unit and log indexing is enabled.

I tried to turn off the mentioned blades and turn them on again, installing database and policies, I stopped the smartevent services in CLI with evstop, evstart, but in none of these tests I got any difference or any result in the reports.

I have even run a cpstop, cpstart and I haven't seen any results in the SmartEvent reports either.

The strange thing is that I can see the logs of the connections that pass through the firewall without any problem, I see traffic through the br1 with a tcpdump by CLI, I don't see any traffic dropped by "fw ctl zdebug + drop", I have an accept any-any rule, but still, I don't see any results in the reports.

Has anyone had something similar happen? or any idea?

Greetings to all!


0 Kudos
6 Replies
Chris_Atkinson
Employee Employee
Employee

What level of logging is configured in the "track" column - Detailed or Extended?

In the Track Column, click on the drop down menu > more. 

Change the Track Settings from Log to Detailed or Extended.

Install the policy. 

CCSM R77/R80/ELITE
0 Kudos
israelsc
Contributor


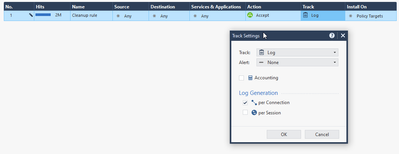
I have the simple "Log" configuration, without "Detailed" or Extended.
I also do not have "Accounting" enabled.
I have attached a screenshot of this.
rule configuration.png

The reason why there is an "any-any" rule is because it is a Poc. My customer has not given us the networks to define them in rules.


0 Kudos
Chris_Atkinson
Employee Employee
Employee

Which reports are you trying to run?

Many will rely on details from AppC logs requiring the change suggested above.

CCSM R77/R80/ELITE
0 Kudos
israelsc
Contributor

I'm trying to run the reports templates that the system has by default, for example "Network Activity" of type 'Access Control' or the "IPS" report of type "Threat Prevention", but in none of them I get results.
It should be noted that I have the firewall, IPS, Anti-Bot, Antivirus blades on. So, in theory it should show me information.

0 Kudos
Chris_Atkinson
Employee Employee
Employee

Apologies I should have read more closely, how much load is the machine under?

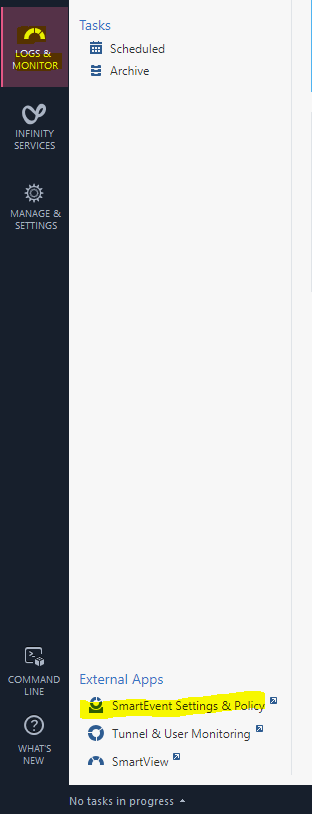
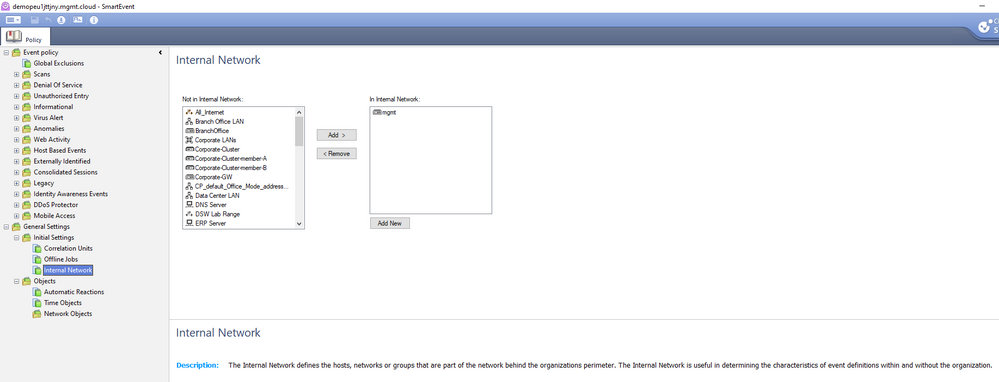
Do you have enough information from the logs to be able to "define" the internal network for the  SmartEvent policy or at least test with a relevant RFC1918 range?

SE Policy.pngInternal_Network.png

CCSM R77/R80/ELITE
0 Kudos
israelsc
Contributor

At the moment my customer has not provided me with the information about their internal networks, but I will try to get this information and define it in the firewall rules to see if it makes any difference in the reports.

0 Kudos

Leaderboard

Epsum factorial non deposit quid pro quo hic escorol.

Upcoming Events

    CheckMates Events