- Products
- Learn
- Local User Groups
- Partners
- More
Introduction to Lakera:
Securing the AI Frontier!
Quantum Spark Management Unleashed!
Check Point Named Leader
2025 Gartner® Magic Quadrant™ for Hybrid Mesh Firewall
HTTPS Inspection
Help us to understand your needs better
CheckMates Go:
SharePoint CVEs and More!
1. Is it possible to see in/out traffic (total bandwidth) of each interface of Checkpoint as graph in Management? How?
2. How to see this kind of VIEW in Management: All IP addresses that destinated to Internet and their traffic near them (sorted by traffic). For example, Source IP:192.168.120.1 Destination:Internet Traffic total:5GB
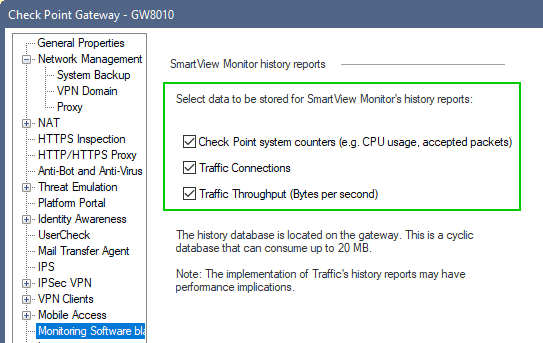
You're likely have to enable these settings to see the pertinent data in a SmartView Monitor:
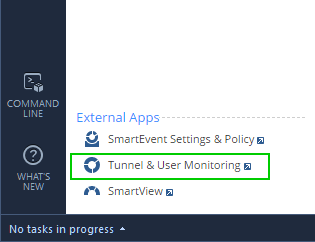
and call-up Smartview Monitor, somewhat counter-intuitively, not from SmartView, but from "Tunnel And User Monitoring:
This depends on the version you are using. What do you have, both MGMT and GW versions?
R 80.10. Both MGMT and GWs
The SmartView Monitor (licensed feature) has always been the answer to such needs, not sure about all the hot new features of R80.xx but logically doubt Checkpoint would provide the same information for free, undermining everyone who pays/paid for SmartView Monitor lic.
R80.X does not have anything new for the matter at this point in time. My reason for asking about the version is that although SmartViewMmonitor GUI client exists, R80.X SmartConsole package, it's not available through SmartConsole itself. Also, config is a bit different in order to make it work.
Any yes, Advanced Networking license (which includes not only Monitoring, but also Clustering and many other popular features) should be attached to the GW in question
We have license for SmarView Monitor, but how to exactly see traffic?
You're likely have to enable these settings to see the pertinent data in a SmartView Monitor:
and call-up Smartview Monitor, somewhat counter-intuitively, not from SmartView, but from "Tunnel And User Monitoring:
In my SmartConsole, there is no "External Apps". How to find it?
under the LOG section should be there ... no?
Too much thanks, I have found! Now I can see what I want.
It shows only real time BANDWITH of interfaces. Can we see its history? For example, last month.
Leaderboard
Epsum factorial non deposit quid pro quo hic escorol.
User | Count |
---|---|
24 | |
15 | |
4 | |
3 | |
3 | |
3 | |
3 | |
3 | |
2 | |
2 |
Tue 30 Sep 2025 @ 08:00 AM (EDT)
Tips and Tricks 2025 #13: Strategic Cyber Assessments: How to Strengthen Your Security PostureTue 07 Oct 2025 @ 10:00 AM (CEST)
Cloud Architect Series: AI-Powered API Security with CloudGuard WAFTue 30 Sep 2025 @ 08:00 AM (EDT)
Tips and Tricks 2025 #13: Strategic Cyber Assessments: How to Strengthen Your Security PostureThu 09 Oct 2025 @ 10:00 AM (CEST)
CheckMates Live BeLux: Discover How to Stop Data Leaks in GenAI Tools: Live Demo You Can’t Miss!Wed 22 Oct 2025 @ 11:00 AM (EDT)
Firewall Uptime, Reimagined: How AIOps Simplifies Operations and Prevents OutagesAbout CheckMates
Learn Check Point
Advanced Learning
YOU DESERVE THE BEST SECURITY