- Products
- Learn
- Local User Groups
- Partners
- More
This website uses Cookies. Click Accept to agree to our website's cookie use as described in our Privacy Policy. Click Preferences to customize your cookie settings.
- Products
- Learn
- Local User Groups
- Upcoming Events
- Americas
- EMEA
- Czech Republic and Slovakia
- Denmark
- Netherlands
- Germany
- Sweden
- United Kingdom and Ireland
- France
- Spain
- Norway
- Ukraine
- Baltics and Finland
- Greece
- Portugal
- Austria
- Kazakhstan and CIS
- Switzerland
- Romania
- Turkey
- Belarus
- Belgium & Luxembourg
- Russia
- Poland
- Georgia
- DACH - Germany, Austria and Switzerland
- Iberia
- Africa
- Adriatics Region
- Eastern Africa
- Israel
- Nordics
- Middle East and Africa
- Balkans
- Italy
- Bulgaria
- Cyprus
- APAC
- Partners
- More
- ABOUT CHECKMATES & FAQ
- Sign In
- Leaderboard
- Events
Inside the SharePoint Zero-Day
What It Means and How to Stay Protected
Introducing Check Point Quantum Spark 2500:
Smarter Security, Faster Connectivity, and Simpler MSP Management!
Open Garden In Action:
Find and Remediate Threats Everywhere!
Check Point Named Leader
Forrester Wave™: Zero Trust Platforms, Q3 2025
Remote Access VPN – User Experience
Help us with the Short-Term Roadmap
CheckMates Go:
AI Agents
Turn on suggestions
Auto-suggest helps you quickly narrow down your search results by suggesting possible matches as you type.
Showing results for
- CheckMates
- :
- Products
- :
- Network & SASE
- :
- Management
- :
- Re: CPViewer - visualize your cpview/cpinfo files ...
Options
- Subscribe to RSS Feed
- Mark Topic as New
- Mark Topic as Read
- Float this Topic for Current User
- Bookmark
- Subscribe
- Mute
- Printer Friendly Page
Turn on suggestions
Auto-suggest helps you quickly narrow down your search results by suggesting possible matches as you type.
Showing results for
Are you a member of CheckMates?
×
Sign in with your Check Point UserCenter/PartnerMap account to access more great content and get a chance to win some Apple AirPods! If you don't have an account, create one now for free!
- Mark as New
- Bookmark
- Subscribe
- Mute
- Subscribe to RSS Feed
- Permalink
- Report Inappropriate Content
Jump to solution
CPViewer - visualize your cpview/cpinfo files in 5 minutes
What is CPViewer?
CPViewer is an open-source community tool which simplifies the way to get a very detailed visual insights into:
1) Exported cpview histories with charts related to CPU, memory, connections and packet rates, throughputs, RX&TX drops etc. using the visualization metrics tool called Grafana;
2) OS analysis (.info file) - healthcheck (sk121447) report for "known issues" and "things not to miss";
The tool comes within an .ova (exported VM) with everything already preconfigured.
The main benefits are:
-
analyzing and identifying performance bottlenecks in minutes
-
user-friendly: just upload it to web-site (no docker or other components needed)
-
Integrated OS analysis tool for richer results (healthcheck script)
-
available to both customers and partners
CPViewer .ova file download - HERE.
CPViewer guide - HERE.
How to use it?
Video below explains all you need to do to get CPViewer up and running - 5 simple steps:
Written step by step guide:
1. Import the VM:
a. Download and import OVA image into your VMWare environment – DOWNLOAD LINK.
b. VM’s network adapter is set to NAT, it has IPv4 – 10.8.0.15, default gw – 10.8.0.2 and DNS – 8.8.8.8 predefined already, but you can adjust this by your needs;
c. Adjust your VMWare NAT adapter;
d. Credentials:
- OS: root/vpn123
- Grafana: admin/Vpn123!
*NOTE: Your VM must have internet access if you want to use GDrive download functionality.
2. Working with CPViewer portal:
a. CPViewer portal can process two types of data:
1) CPInfo files (contains cpinfo and cpview files) -> you will get 2 reports, grafana cpview insights and cpinfo OS analysis report (in separate tab);
2) CPView (.dat or .gz – with .dat in it) files only;
*NOTE: In case you are using type 1, please be aware that you need to either configure your browser to allow pop-ups for http://10.8.0.15:80 in order to get the CPInfo healthcheck report. Other option is just to go to http://10.8.0.15/healthcheck_reports manually and select a report you need.
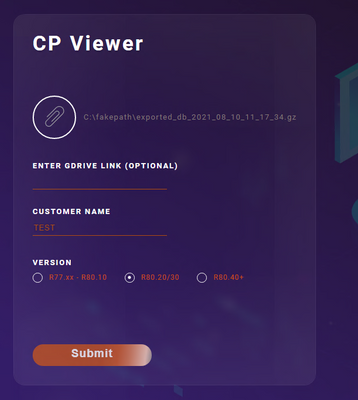
b. After setting up the VM, open any browser and go to CPViewer portal -> http://10.8.0.15.
Select upload method:
1) Manual/attachment upload: you can submit .dat or .gz file (which contains .dat);
2) Google link (server will automatically download file from GDrive). In this case solid upload link is highly recommended;
*NOTE: You can pick one of the two methods, not both at the same time;
c. Enter customer`s name (this will be used for name db and datasource of cpview; d. Select version from which cpview was exported – R77.30 – R80.10 or R80.20+;
e. If you did all of the above, select the submit button and wait for your reports to get created;
*NOTE: Speed of the processing will depetend on the size of the file (upload time + querying/healthcheck.sh execution through the .dat/.info and taking all the relevant info).
3. After you get redirected to Grafana you will be able to see your cpview visualized through graphs focused on different parameters. In case you uploaded CPInfo file you will also get GW`s healthcheck report in a separate tab.
Few useful GrafanaUI details:
- Top left corner – selected datasource (datasources will automatically be deleted on weekly basis);
- On menu at the far left you will be able to see possible dashboards (do not need to be changed since everything related to your cpview is automatically provisioned);
- Top right corner – time span which we are looking into (this is also automatically set from the first to the last timestmmp from your cpview);
- When clicking on different views you will be able to adjust some parameters or queries according to your needs;
*NOTE: All datasources – their dbs and healthcheck reports are being automatically deleted every Monday at midnight. If you do not want this – enter crontab using command crontab – e from CLI, erase the camm of deleteALL.php and/or delete_hc.sh script/s and save it.
*DISCLAIMER - This open source tool is provided “As Is”. No representations or warranties are provided with the use of this tool.
110 Replies
- Mark as New
- Bookmark
- Subscribe
- Mute
- Subscribe to RSS Feed
- Permalink
- Report Inappropriate Content
Hi Petar
I downloaded the ova however the ESX fails to import it.
I get the following error.
can u help?
- Mark as New
- Bookmark
- Subscribe
- Mute
- Subscribe to RSS Feed
- Permalink
- Report Inappropriate Content
Hi,
I am assuming that the specific version of vSphere client which you are using doesn't support SHA256 hashing algorithm which OVA was made with.
There is a tool called "ovftool" which you can use to convert the it from sha256 to sha1 which is supported by the vSphere client you got.
Tool: https://www.vmware.com/support/developer/ovf/
More details on the error:
- Mark as New
- Bookmark
- Subscribe
- Mute
- Subscribe to RSS Feed
- Permalink
- Report Inappropriate Content
thanks a lot!
I
- Mark as New
- Bookmark
- Subscribe
- Mute
- Subscribe to RSS Feed
- Permalink
- Report Inappropriate Content
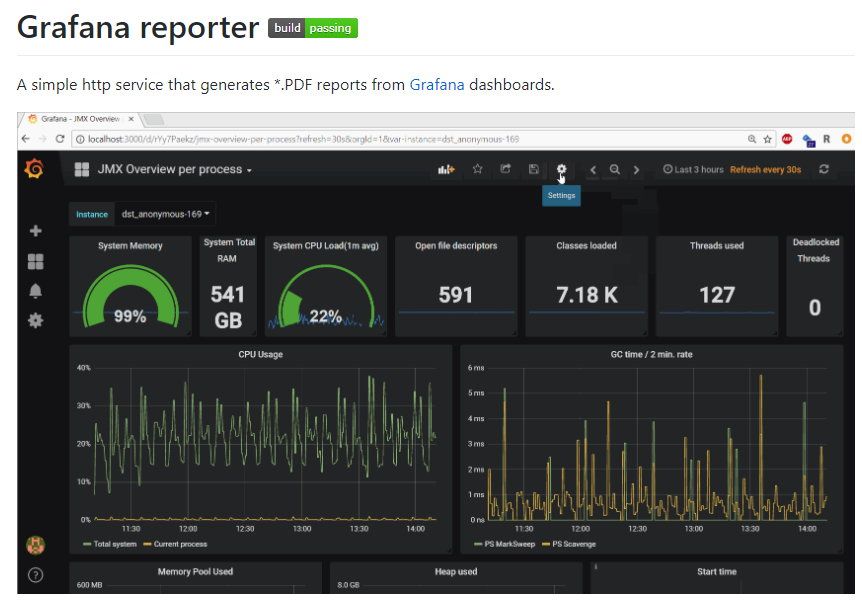
For exporting the graphs you can use Grafana Reporter which can be found here: https://github.com/IzakMarais/reporter
- Mark as New
- Bookmark
- Subscribe
- Mute
- Subscribe to RSS Feed
- Permalink
- Report Inappropriate Content
As an addition to the CPViewer, you can use the Reporter tool mentioned below to make PDF reports out of the Grafana graphs
You use it on Linux or within docker as a container and connect to your Grafana (CPViewer)
More information on: https://github.com/IzakMarais/reporter
- Mark as New
- Bookmark
- Subscribe
- Mute
- Subscribe to RSS Feed
- Permalink
- Report Inappropriate Content
This does not seem straightforward to install.
Need to install 'go' and then then instructions basically do not work, is their a step-by-step guide on installing and using this?
- Mark as New
- Bookmark
- Subscribe
- Mute
- Subscribe to RSS Feed
- Permalink
- Report Inappropriate Content
Hello Mark.
I believe that saving reports as PDF requires Grafana Enterprise. Also version 5 is really old and a lot of the APIs don't really work the same anymore. Have you made any tests with version 7.x ?
- Mark as New
- Bookmark
- Subscribe
- Mute
- Subscribe to RSS Feed
- Permalink
- Report Inappropriate Content
Hello,
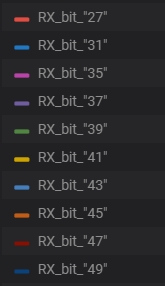
I am wondering if someone can help me to understand how to pin point this information in Interface Throughput graph with real interface names? (R80.40)
- Mark as New
- Bookmark
- Subscribe
- Mute
- Subscribe to RSS Feed
- Permalink
- Report Inappropriate Content
Hi Maria,
Sorry for late reply.
In R80.40 cpview DB structure is a bit changed and this is why you get the above values for if names. Anyways, I've released a new version of CPViewer back in May which should fix the issue. The download link has been updated.
- Mark as New
- Bookmark
- Subscribe
- Mute
- Subscribe to RSS Feed
- Permalink
- Report Inappropriate Content
Hello.
Does this tool can be used with SMB appliances cpinfo file?
- Mark as New
- Bookmark
- Subscribe
- Mute
- Subscribe to RSS Feed
- Permalink
- Report Inappropriate Content
The cpinfo from an SMB appliance has different data in a different format.
Therefore, probably not, but try it and see 🙂
- Mark as New
- Bookmark
- Subscribe
- Mute
- Subscribe to RSS Feed
- Permalink
- Report Inappropriate Content
Hi @Petar_Markota !
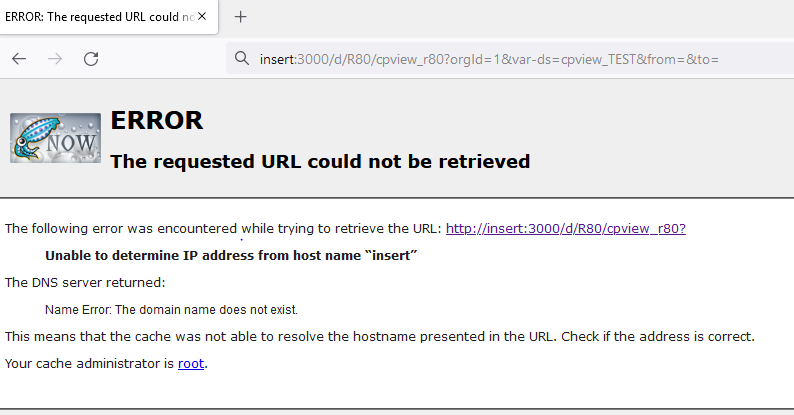
Thank you for your tool! Sadly I've encountered an issue when uploading the CPView.dat file:
Can you help me here?
Thanks in advance!
- Mark as New
- Bookmark
- Subscribe
- Mute
- Subscribe to RSS Feed
- Permalink
- Report Inappropriate Content
Hi @ggrab ,
This happens after you submit the .dat for processing? Also, what is it that you are submitting? Not sure why is there "insert" instead of the IP of the machine.
- Mark as New
- Bookmark
- Subscribe
- Mute
- Subscribe to RSS Feed
- Permalink
- Report Inappropriate Content
Hi @Petar_Markota ,
thank you for your fast reply!
I get this error after submitting the cpview history database which i got from my R80.30SP gateway. (I tried both, uploading the .gz and the .dat file which leads to the same result)
- Mark as New
- Bookmark
- Subscribe
- Mute
- Subscribe to RSS Feed
- Permalink
- Report Inappropriate Content
That's strange. I also tested it out today on the export from R80.30SP and it worked well. Did you try downloading and importing fresh VM? Which browser are you using?
- Mark as New
- Bookmark
- Subscribe
- Mute
- Subscribe to RSS Feed
- Permalink
- Report Inappropriate Content
Hi Petar_Markota
Is it works at throughput on R81.10?
The throughput image is empty.
- Mark as New
- Bookmark
- Subscribe
- Mute
- Subscribe to RSS Feed
- Permalink
- Report Inappropriate Content
- Mark as New
- Bookmark
- Subscribe
- Mute
- Subscribe to RSS Feed
- Permalink
- Report Inappropriate Content
Please use Skyline for R81.10
- Mark as New
- Bookmark
- Subscribe
- Mute
- Subscribe to RSS Feed
- Permalink
- Report Inappropriate Content
Hi Val.
Is there a way to view historical CPView data, specifically for R81.10 gateways?
When I try and use CPViewer it does not work.
- Mark as New
- Bookmark
- Subscribe
- Mute
- Subscribe to RSS Feed
- Permalink
- Report Inappropriate Content
@Christopher_To First, yes, it should work with this tool.
However, it is practically obsolete. You want to use either Skyline or Diagnostics Tool these days. Mind, CPVIEW only keeps one month of history.
- Mark as New
- Bookmark
- Subscribe
- Mute
- Subscribe to RSS Feed
- Permalink
- Report Inappropriate Content
How do you upload historical CPView exported data into Skyline the deployment? Can I upload directly to Prometheus or Grafana?
- Mark as New
- Bookmark
- Subscribe
- Mute
- Subscribe to RSS Feed
- Permalink
- Report Inappropriate Content
good question - I just created a VM, went through the installation process using the latest updated files, but this is all offline; it would be good to import data into Skyline to review the history information via the WEBUI frontend.
- Mark as New
- Bookmark
- Subscribe
- Mute
- Subscribe to RSS Feed
- Permalink
- Report Inappropriate Content
Skyline currently works with live data only (not cpview historical data).
- Mark as New
- Bookmark
- Subscribe
- Mute
- Subscribe to RSS Feed
- Permalink
- Report Inappropriate Content
That's a shame, it might be a good option to consider importing data for offline review.
- Mark as New
- Bookmark
- Subscribe
- Mute
- Subscribe to RSS Feed
- Permalink
- Report Inappropriate Content
@PhoneBoy I 2nd this. Can this be added as an option?
I tried to use CPViewer for historical CPView data from an R81.10 gateway and it just kept erroring out after trying to upload the .dat file. Do you know if this is an issue because of the gateway version? I will try again with CPView data from an R80.40 gateway.
- Mark as New
- Bookmark
- Subscribe
- Mute
- Subscribe to RSS Feed
- Permalink
- Report Inappropriate Content
I use this tool to visualize historical system data fast and easy.
- Mark as New
- Bookmark
- Subscribe
- Mute
- Subscribe to RSS Feed
- Permalink
- Report Inappropriate Content
Nice Danny!
- Mark as New
- Bookmark
- Subscribe
- Mute
- Subscribe to RSS Feed
- Permalink
- Report Inappropriate Content
Hello Danny, the tool seems to be very cool, anyway data about cpu utilization seems to be misleading compared to cpviewer.
the tool divides system and user cpu utilization, cpviewer aggregates both data, and this is much more efficient for troubleshooting and to properly size a tech refresh
do you agree? ty
- Mark as New
- Bookmark
- Subscribe
- Mute
- Subscribe to RSS Feed
- Permalink
- Report Inappropriate Content
@Arik_Ovtracht are we looking at being able to replay cpview data through Skyline (to give some historical data)?
- Mark as New
- Bookmark
- Subscribe
- Mute
- Subscribe to RSS Feed
- Permalink
- Report Inappropriate Content
Yes, we have plans to create some kind of 'local Skyline' which would be available directly on the GWs. However, this is a very early idea, we have not started development on it.
Just to note - Skyline exports live data, but the exported data is saved on the external monitoring server (Prometheus database), and can be accessed from there indefinitely.
Leaderboard
Epsum factorial non deposit quid pro quo hic escorol.
| User | Count |
|---|---|
| 18 | |
| 4 | |
| 3 | |
| 2 | |
| 2 | |
| 2 | |
| 2 | |
| 1 | |
| 1 | |
| 1 |
Upcoming Events
Thu 31 Jul 2025 @ 10:00 AM (CEST)
CloudGuard Network Security for Nutanix - Full Deployment with Tenant & Transit VPC - EMEA/APACThu 31 Jul 2025 @ 05:00 PM (CEST)
CloudGuard Network Security for Nutanix - Full Deployment with Tenant & Transit VPC - AMER/EMEATue 12 Aug 2025 @ 10:00 AM (CEST)
Ransomware Redefined: What Q2 2025 Tells Us About the Future of Extortion - EMEATue 12 Aug 2025 @ 05:00 PM (CEST)
Ransomware Redefined: What Q2 2025 Tells Us About the Future of Extortion - AMERThu 31 Jul 2025 @ 10:00 AM (CEST)
CloudGuard Network Security for Nutanix - Full Deployment with Tenant & Transit VPC - EMEA/APACThu 31 Jul 2025 @ 05:00 PM (CEST)
CloudGuard Network Security for Nutanix - Full Deployment with Tenant & Transit VPC - AMER/EMEATue 12 Aug 2025 @ 10:00 AM (CEST)
Ransomware Redefined: What Q2 2025 Tells Us About the Future of Extortion - EMEATue 12 Aug 2025 @ 05:00 PM (CEST)
Ransomware Redefined: What Q2 2025 Tells Us About the Future of Extortion - AMERTue 19 Aug 2025 @ 08:00 AM (CST)
Tegucigalpa: Entrenamiento Práctico SBTR82 para la Comunidad CheckMatesWed 23 Jul 2025 @ 08:00 AM (CDT)
San Pedro Sula: Entrenamiento Práctico SBTR82 para la Comunidad CheckMatesAbout CheckMates
Learn Check Point
Advanced Learning
YOU DESERVE THE BEST SECURITY
©1994-2025 Check Point Software Technologies Ltd. All rights reserved.
Copyright
Privacy Policy
About Us
UserCenter


