- Products
- Learn
- Local User Groups
- Partners
- More
Check Point Jump-Start Online Training
Now Available on CheckMates for Beginners!
Why do Hackers Love IoT Devices so Much?
Join our TechTalk on Aug 17, at 5PM CET | 11AM EST
Welcome to Maestro Masters!
Talk to Masters, Engage with Masters, Be a Maestro Master!
ZTNA Buyer’s Guide
Zero Trust essentials for your most valuable assets
The SMB Cyber Master
Boost your knowledge on Quantum Spark SMB gateways!
As YOU DESERVE THE BEST SECURITY
Upgrade to our latest GA Jumbo
CheckFlix!
All Videos In One Space
Hi all,
Would like to check if it is possible to find out the routing table in each of the firewall through R80. This includes both static and dynamic routes that can be found in the firewall. Please advise me as I look through the API reference and could not find something that lead me to get the routing table. Thanks.
Regards,
Jun Liang
Hi,
You can use run-script API to do this : Check Point - Management API reference
Send a "show route" command to single/multiple gateway with one API command and retreive result via task content
Hi Marc,
Thanks for the reply. I was just testing this recently and I got this error from Postman API. Any idea what this could mean? Thanks. I verified that the target is correct as I have tried to put in a wrong target and it give me a separate set of error. By the way, the response status code is 500 Server Error.
I put the following into the body:
{
"script-name" : "Script to get routes",
"script" : "show route",
"targets": "gateway-dummy",
"set-session-id" : true
}
I got this results:
{
"code": "generic_error",
"message": "Null Pointer exception: null"
}
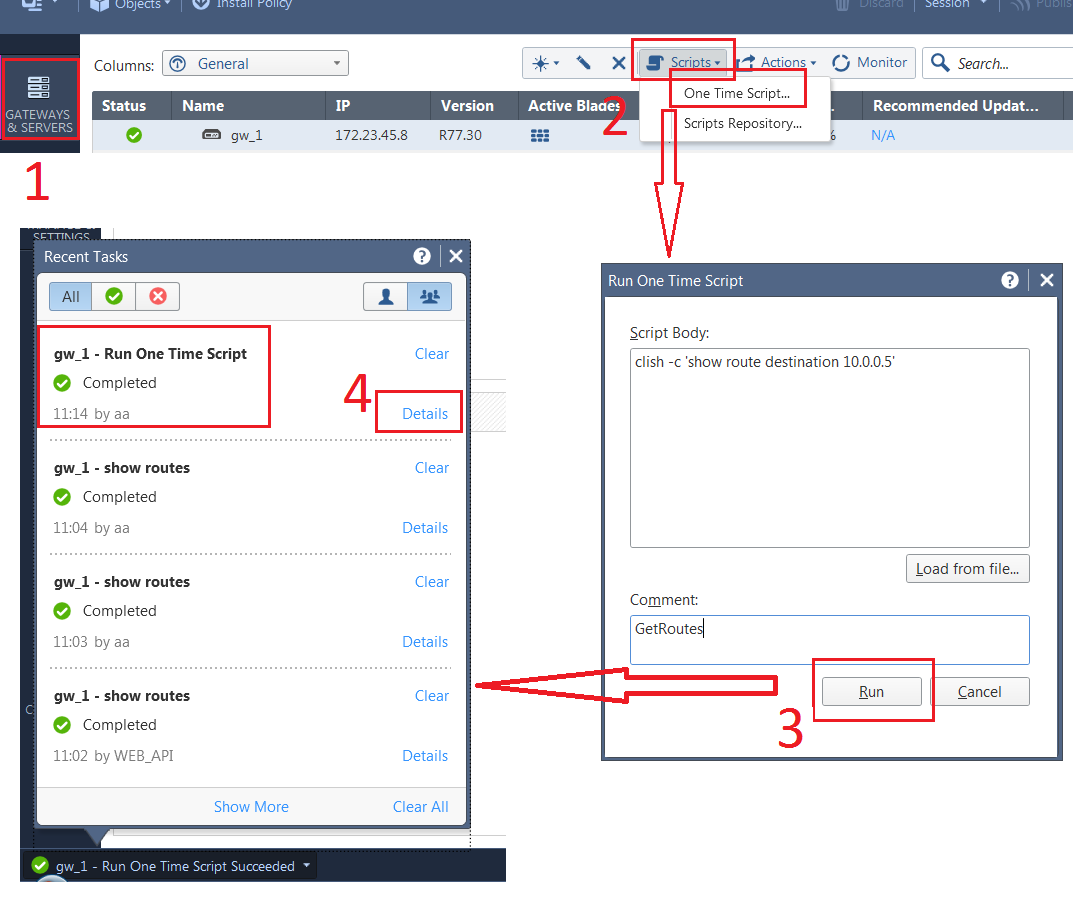
This command will run in "BASH" mode
for clish mode is needed to run clish command .
1. login
2. run-script
{
"script-name" : "show routes",
"script" : "netstat -nr",
"targets" : [ "mgmt" ]
}
Results:
{
"tasks": [
{
"target": "mgmt",
"task-id": "b3ee3851-8c50-47e7-96a5-5b897538bab9"
}
]
}
3. show-task
{
"task-id" : "b3ee3851-8c50-47e7-96a5-5b897538bab9" ,
"details-level" : "full"
}
Results:
{
"tasks": [
{
"uid": "690c8f82-d1d1-4060-96ea-86a99950cfe0",
"name": "mgmt - show routes",
"type": "CdmTaskNotification",
"domain": {
"uid": "41e821a0-3720-11e3-aa6e-0800200c9fde",
"name": "SMC User",
"domain-type": "domain"
},
"task-id": "b3ee3851-8c50-47e7-96a5-5b897538bab9",
"task-name": "mgmt - show routes",
"status": "succeeded",
"progress-percentage": 100,
"start-time": {
"posix": 1501670168404,
"iso-8601": "2017-08-02T13:36+0300"
},
"last-update-time": {
"posix": 1501670170686,
"iso-8601": "2017-08-02T13:36+0300"
},
"suppressed": false,
"task-details": [
{
"uid": "aa1e472e-9a7c-47e1-891a-a060e3b4262a",
"name": null,
"domain": {
"uid": "41e821a0-3720-11e3-aa6e-0800200c9fde",
"name": "SMC User",
"domain-type": "domain"
},
"color": "black",
"statusCode": "succeeded",
"statusDescription": "Kernel IP routing table, Destination Gateway Genmask Flags MSS Window irtt Iface, 1.1.1.0 0.0.0.0 255.255.255.254 U 0 0 0 eth0.3, 10.0.0.0 0.0.0.0 255.255.0.0 U 0 0 0 eth0, 0.0....",
"taskNotification": "690c8f82-d1d1-4060-96ea-86a99950cfe0",
"gatewayId": "37308a02-7395-0a43-9765-562fabbd76c2",
"gatewayName": "",
"transactionId": 235893072,
"responseMessage": "S2VybmVsIElQIHJvdXRpbmcgdGFibGUKRGVzdGluYXRpb24gICAgIEdhdGV3YXkgICAgICAgICBHZW5tYXNrICAgICAgICAgRmxhZ3MgICBNU1MgV2luZG93ICBpcnR0IElmYWNlCjEuMS4xLjAgICAgICAgICAwLjAuMC4wICAgICAgICAgMjU1LjI1NS4yNTUuMjU0IFUgICAgICAgICAwIDAgICAgICAgICAgMCBldGgwLjMKMTAuMC4wLjAgICAgICAgIDAuMC4wLjAgICAgICAgICAyNTUuMjU1LjAuMCAgICAgVSAgICAgICAgIDAgMCAgICAgICAgICAwIGV0aDAKMC4wLjAuMCAgICAgICAgIDEwLjAuMC4xICAgICAgICAwLjAuMC4wICAgICAgICAgVUcgICAgICAgIDAgMCAgICAgICAgICAwIGV0aDAK",
"responseError": "",
"meta-info": {
"validation-state": "ok",
"last-modify-time": {
"posix": 1501670170723,
"iso-8601": "2017-08-02T13:36+0300"
},
"last-modifier": "admin",
"creation-time": {
"posix": 1501670168688,
"iso-8601": "2017-08-02T13:36+0300"
},
"creator": "admin"
},
"tags": [],
"icon": "General/globalsNa",
"comments": "",
"display-name": "",
"customFields": null
}
],
"comments": "Completed",
"color": "black",
"icon": "General/globalsNa",
"tags": [],
"meta-info": {
"lock": "unlocked",
"validation-state": "ok",
"last-modify-time": {
"posix": 1501670170705,
"iso-8601": "2017-08-02T13:36+0300"
},
"last-modifier": "admin",
"creation-time": {
"posix": 1501670168440,
"iso-8601": "2017-08-02T13:36+0300"
},
"creator": "admin"
},
"read-only": false
}
]
}
4. base64 for "responseMessage"
Results:
Kernel IP routing table
Destination Gateway Genmask Flags MSS Window irtt Iface
1.1.1.0 0.0.0.0 255.255.255.254 U 0 0 0 eth0.3
10.0.0.0 0.0.0.0 255.255.0.0 U 0 0 0 eth0
0.0.0.0 10.0.0.1 0.0.0.0 UG 0 0 0 eth0
Thanks!
This might not be related but it seems like I'm facing the issue still despite me issuing simple commands like "ls -lh".
I'm using a VSX (77.3) for my gateway - using R80 (not R80.10).
I put the following into the body:
{
"script-name" : "show route",
"script" : "ls -lh",
"targets": "gateway-dummy",
"set-session-id" : true
}
I got this results:
{
"code": "generic_error",
"message": "Null Pointer exception: null"
}
In case you are using VSX , you will need to use the vsx_provisioning .
You will need to run the run-script command for the management server as the target .
Please see page 15 "show vd name"
Showing Virtual Device Data
show vd name <vd name>
Parameter : vd name
Value : Name of the Virtual Device
Notes : Required
Comments:
• Only non-automatic routes are displayed. Routes which are automatically created with route propagation are not displayed.
• For Virtual Router and Virtual Switch: automatically created wrpj interfaces which connect to a Virtual System are not displayed.
I would recommend to get the routing table with:
ip route show
The netstat -nr output will only show 1 default route. And if you had another default route still in place from the initial configuratation you will fail to find it with netstat -nr. The ip route show command however will show you both.
(Finding this at 04:45 after a long night with some failed patch installations was not the best moment I can tell from personal experience.)
How would we specify domain in run-script in case of environment with MDM? Is there a mechanism that the script run on all the servers being managed under that domain?
Hello,
My RestAPI executes fine but my output only gives the following
{"tasks": [{"target": "mgmt","task-id": "b3ee3851-8c50-47e7-96a5-5b897538bab9"}]}
how do I get to show the entire Results in REST API. Is there a specific method I need to call in power shell to display the entire result
What is your REST API request, request body?
Please post here.
My PowerShell Code
==========================================================================
# Ignore SSL cert Exception
[System.Net.ServicePointManager]::ServerCertificateValidationCallback = {$true}
# Login to Management server and obtain sid
$URL = "https://xx.xx.xx.xx/web_api"
$Action = "/login"
$URLAnon = "$URL$Action"
$headers = @{ "Content-Type" = "application/json"
}
$login = @{
"user" = "myadmin"
"password" = "mypassword"
}
$login = $login | ConvertTo-Json
$response = Invoke-RestMethod -Method Post -Headers $headers -Uri $URLAnon -Body $login
$sid = $response.sid
# run-as script
$Action = "/run-script"
$URLAnon = "$URL$Action"
$headers = @{
"Content-Type" = "application/json"
"X-chkp-sid" = $sid
}
$ScriptDetails =@{
"script-name" = "GetRoutes"
"script" = "clish -c 'show route destination 10.0.0.5'"
"targets" = "MyINTERNETGW1","MyINTERNETGW2"
}
$ScriptDetails = $ScriptDetails | ConvertTo-Json
#Write-Host $ScriptDetails
$response = Invoke-RestMethod -Method Post -Headers $headers -Uri $URLAnon -Body $ScriptDetails
#Write-Output $response | ConvertTo-Json -Depth 10
Write-Output $response
# PUBLISH to Management Server
$EmptyPayload =@{}
$EmptyPayload = $EmptyPayload | ConvertTo-Json
$Action = "/publish"
$URLAnon = "$URL$Action"
$publish = Invoke-RestMethod -Method Post -Headers $headers -Uri $URLAnon -Body $EmptyPayload
# Logout of management server
$Action = "/logout"
$URLAnon = "$URL$Action"
$logout = Invoke-RestMethod -Method Post -Headers $headers -Uri $URLAnon -Body $EmptyPayload
==========================================================
Result:
tasks
-----
{@{target=MyINTERNETGW1; task-id=0c403efc-c4e6-4cea-bee1-40d35a9c3992}, @{target=MyINTERNETGW2; task-id=8...}}
============================
I wanted to get the entire output result stream and not just the task-id as result
by the way, the script I have executes fine. I added commands like 'set radius server' and they are getting executed properly on the gateway. I just don't know, why I am unable to view the entire output stream as my result.
Hi,
The response of run-script API command is a list of async tasks -
https://sc1.checkpoint.com/documents/latest/APIs/index.html#web/run-script~v1.1
You should monitor these tasks using show-task API command -
https://sc1.checkpoint.com/documents/latest/APIs/index.html#web/show-task~v1.1
Take a look at this thread -
Hope this helps.
Robert.
OK. Thank you. This makes lot sense now.
I did execute show-task rest-api and I get more details about the task, but still I am missing the Response message output. I need the response message to take it further
My show-task script
====================
# Ignore SSL cert Exception
[System.Net.ServicePointManager]::ServerCertificateValidationCallback = {$true}
# Login to Management server and obtain sid
$URL = "https://xx.xx.xx.xx/web_api"
$Action = "/login"
$URLAnon = "$URL$Action"
$headers = @{ "Content-Type" = "application/json"
}
$login = @{
"user" = "myadmin"
"password" = "mypassword"
}
$login = $login | ConvertTo-Json
$response = Invoke-RestMethod -Method Post -Headers $headers -Uri $URLAnon -Body $login
$sid = $response.sid
# show-task
$Action = "/show-task"
$URLAnon = "$URL$Action"
$ShowTaskID =@{
"task-id" = "19a88357-1856-4ce6-9d1a-f3d2a4503903"
"details-level" = "full"
}
$ShowTaskID = $ShowTaskID | ConvertTo-Json
$response = Invoke-RestMethod -Method Post -Headers $headers -Uri $URLAnon -Body $ShowTaskID
Write-Output $response
# Logout of management server
$EmptyPayload =@{}
$EmptyPayload = $EmptyPayload | ConvertTo-Json
$Action = "/logout"
$URLAnon = "$URL$Action"
$logout = Invoke-RestMethod -Method Post -Headers $headers -Uri $URLAnon -Body $EmptyPayload
show-task output
====================
{
"tasks": [
{
"uid": "5e3855cb-36d3-46e6-8476-553bbd594a5a",
"name": "MyINTERNETGW2 - Get-routes",
"type": "CdmTaskNotification",
"domain": "@{uid=41e821a0-3720-11e3-aa6e-0800200c9fde; name=SMC User; domain-type=domain}",
"task-id": "19a88357-1856-4ce6-9d1a-f3d2a4503903",
"task-name": "MyINTERNETGW2 - Get-routes",
"status": "succeeded",
"progress-percentage": 100,
"start-time": "@{posix=1521683386071; iso-8601=2018-03-21T21:49-0400}",
"last-update-time": "@{posix=1521683387988; iso-8601=2018-03-21T21:49-0400}",
"suppressed": false,
"task-details": "",
"comments": "Completed",
"color": "black",
"icon": "General/globalsNa",
"tags": "",
"meta-info": "@{lock=unlocked; validation-state=ok; last-modify-time=; last-modifier=myadmin; creation-t
ime=; creator=myadmin}",
"read-only": false
}
]
}
Hi,
I saw that the "task-details" field in you response is empty.
Try to execute the same script in SmartConsole GUI as follows, and see what happens -
Robert.
BTW, I also used mgmt_cli tool on my management server to run your script on my gateway, and works fine and returns results as expected...
Second thoughts: try to set only one gateway as a terget for the script.
did you finally got what expected? I would like to get CPU, RAM, Disk and perhaps a few "services or deamon" information via REST (PowerShell).
Could you paste the complete script? Any hints or suggestions?
Many thanks in advance
Ruben
This isn't via the API, but if you have the monitoring blade enabled, you can view both the static and dynamic routes in SmartConsole...
1. Go to the Gateways and Servers tab
2. Select the device you want to view the routes on
3. Click on Device & License Information...
4. Click on Network Activity
5. Scroll all the way to the bottom and click Routing Table
6. Enjoy
About CheckMates
Learn Check Point
Advanced Learning
YOU DESERVE THE BEST SECURITY