- Products
Quantum
Secure the Network IoT Protect Maestro Management OpenTelemetry/Skyline Remote Access VPN SD-WAN Security Gateways SmartMove Smart-1 Cloud SMB Gateways (Spark) Threat PreventionCloudGuard CloudMates
Secure the Cloud CNAPP Cloud Network Security CloudGuard - WAF CloudMates General Talking Cloud Podcast - Learn
- Local User Groups
- Partners
- More

This website uses Cookies. Click Accept to agree to our website's cookie use as described in our Privacy Policy. Click Preferences to customize your cookie settings.
- Products
- Quantum (Secure the Network)
- CloudGuard CloudMates
- Harmony (Secure Users and Access)
- Infinity Core Services (Collaborative Security Operations & Services)
- Developers
- Check Point Trivia
- CheckMates Toolbox
- General Topics
- Infinity Portal
- Products Announcements
- Threat Prevention Blog
- CheckMates for Startups
- Learn
- Local User Groups
- Upcoming Events
- Americas
- EMEA
- Czech Republic and Slovakia
- Denmark
- Netherlands
- Germany
- Sweden
- United Kingdom and Ireland
- France
- Spain
- Norway
- Ukraine
- Baltics and Finland
- Greece
- Portugal
- Austria
- Kazakhstan and CIS
- Switzerland
- Romania
- Turkey
- Belarus
- Belgium & Luxembourg
- Russia
- Poland
- Georgia
- DACH - Germany, Austria and Switzerland
- Iberia
- Africa
- Adriatics Region
- Eastern Africa
- Israel
- Nordics
- Middle East and Africa
- Balkans
- Italy
- APAC
- Partners
- More
- ABOUT CHECKMATES & FAQ
- Sign In
- Leaderboard
- Events
May the 4th (+4)
Roadmap Session and Use Cases for
Cloud Security, SASE, and Email Security
SASE Masters:
Deploying Harmony SASE for a 6,000-Strong Workforce
in a Single Weekend
Paradigm Shifts: Adventures Unleashed!
Capture Your Adventure for a Chance to WIN!
Mastering Compliance
Unveiling the power of Compliance Blade
CPX 2024 Content
is Here!
Harmony SaaS
The most advanced prevention
for SaaS-based threats
CheckMates Go:
CPX 2024 Recap
Turn on suggestions
Auto-suggest helps you quickly narrow down your search results by suggesting possible matches as you type.
Showing results for
- CheckMates
- :
- Products
- :
- Quantum
- :
- Management
- :
- Threat Prevention Cyber-attacks dashboard
Options
- Subscribe to RSS Feed
- Mark Topic as New
- Mark Topic as Read
- Float this Topic for Current User
- Bookmark
- Subscribe
- Mute
- Printer Friendly Page
Turn on suggestions
Auto-suggest helps you quickly narrow down your search results by suggesting possible matches as you type.
Showing results for
Are you a member of CheckMates?
×
Sign in with your Check Point UserCenter/PartnerMap account to access more great content and get a chance to win some Apple AirPods! If you don't have an account, create one now for free!
- Mark as New
- Bookmark
- Subscribe
- Mute
- Subscribe to RSS Feed
- Permalink
- Report Inappropriate Content
Threat Prevention Cyber-attacks dashboard
****************************************************************update****************************************************************
Hey,
few months ago, we started to work the new dashboard for Threat Prevention Investigation methods.
i am happy to announce that we formally released the version for R80.10 under the following SK - sk134634
you are welcome to look on the related post for this release
****************************************************************update****************************************************************
Hey all,
We are considering adding new dashboards to Smart View, and would love your input.
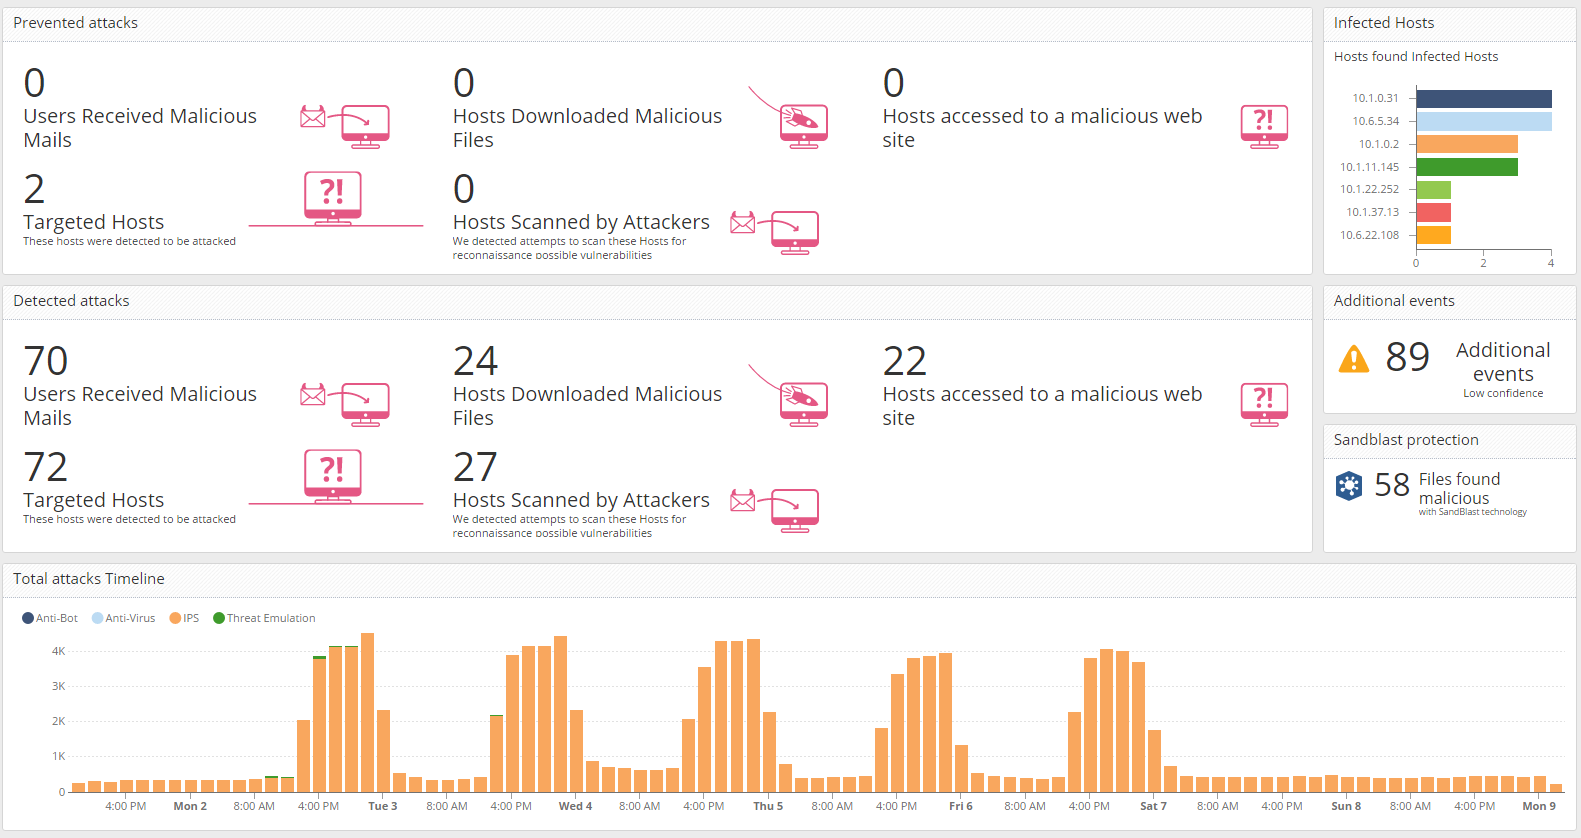
One of them is the ‘Threat Prevention Cyber-attacks dashboard’ divided to business questions:
- Malicious files
- User received malicious files via mail
- User downloaded malicious files from web
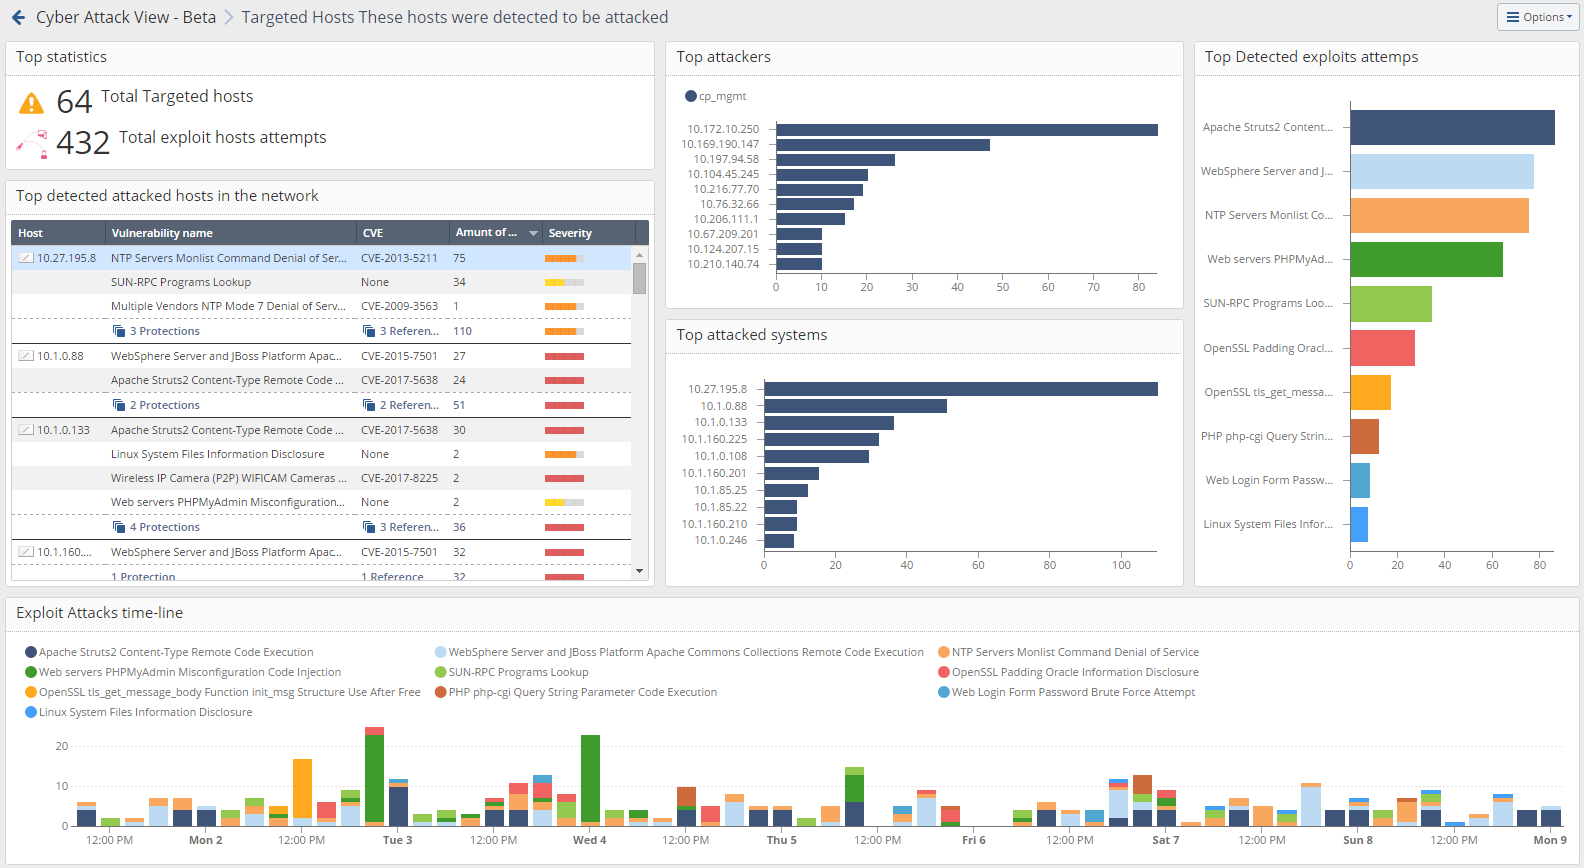
- Hosts exploit attempts
- Hosts scanning
- Users surfed to malicious web-sites
- Infected hosts
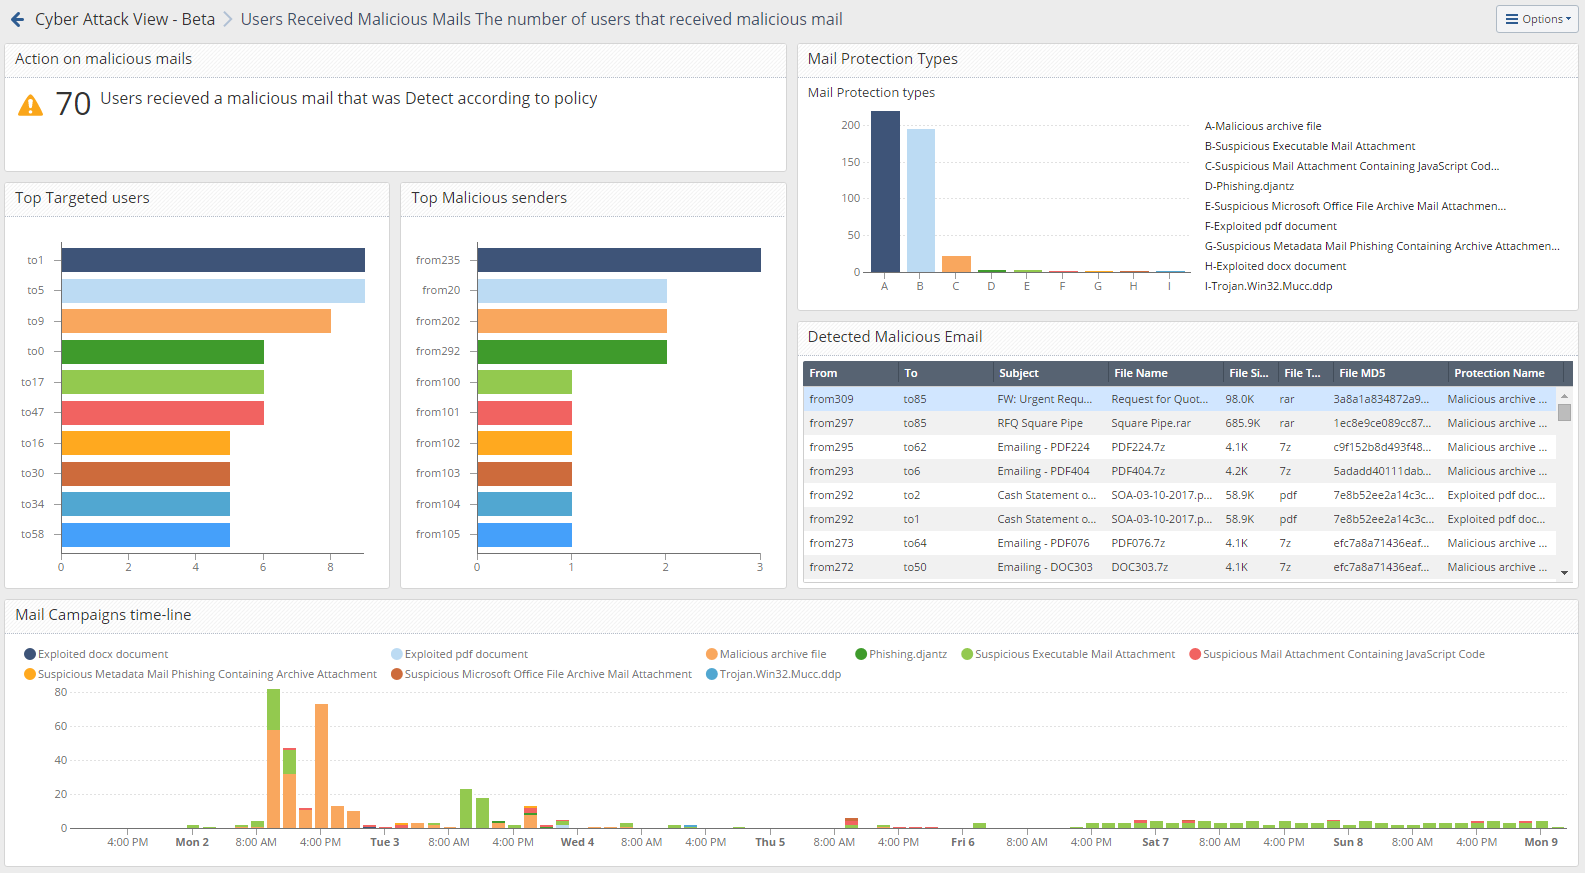
For each question – we created a drill-down dashboard (by double clicking the number OR text, you will deep-dive to the next dashboard).
By double clicking again on an IOC (Indicator of compromise), you will get the logs of the attack you are interested to see and related to this IOC. The dashboard is divided into prevent & detect sections.
Examples:
FAQ
How can I upload the dashboard into my environment?
- Download the attached file
- Extract the archive
- Click ‘logs and monitor’ -> open a new tab by clicking
 -> click Views -> Actions -> Import Template
 - Import all the files (they are connected to each other in the dashboard)
- Click on the view ‘Cyber Attack View - Beta’ and start to investigate
If I find a malfunction/have a suggestion for one of the views, what should I do?
- You can edit the queries/delete the non-relevant widgets if you find them not relevant for your network.
- Send me a direct mail : orenkor@checkpoint.com with the malfunction/suggestion so we will be able to fix it(please add your SE/Account to the mail + Screen shot for better understanding)
- Comment in this thread
Can I copy some of the widgets into my own dashboard?
Ofcorse – right click the title of the widget and copy it.
For which versions this dashboard is working?
This dashboard was created for R80.10 version and above
For which blades is this dashboard is relevant?
Anti-Bot, Anti-Virus, IPS, Threat Emulation
Thanks,
Oren
Labels
- Labels:
-
Logging
-
Monitoring
-
Reports
-
SmartEvent
56 Replies
- Mark as New
- Bookmark
- Subscribe
- Mute
- Subscribe to RSS Feed
- Permalink
- Report Inappropriate Content
Excellent post! Thanks a lot for the templates!
- Mark as New
- Bookmark
- Subscribe
- Mute
- Subscribe to RSS Feed
- Permalink
- Report Inappropriate Content
Awesome and very useful, thank u for that
- Mark as New
- Bookmark
- Subscribe
- Mute
- Subscribe to RSS Feed
- Permalink
- Report Inappropriate Content
Hi Oren.
Do you have to have all four blades enabled to use the reports?
-Jason
- Mark as New
- Bookmark
- Subscribe
- Mute
- Subscribe to RSS Feed
- Permalink
- Report Inappropriate Content
Hey Jason,
you dont need them four to be enabled to get some of the logic.
lets take an example for detected malicious mails:
((blade:ips AND action:Detect AND ("Adobe Reader Violation" OR "Content Protection Violation" OR "Mail Content Protection Violation" OR "SMTP Protection Violation" OR "Phishing Enforcement Protection" OR "Adobe Flash Protection Violation") AND confidence_level:(Medium OR Medium-High OR High)) OR (blade:"Threat Emulation" AND action:Detect AND confidence_level:(Medium OR Medium-High OR High)) OR (blade:Anti-Virus AND action:Detect AND confidence_level:(Medium OR Medium-High OR High))) AND smtp
you can see in this query the different blades and what we are looking for in each and one of them in the high-level query.
if you have only one blade enable - you will get only a part of the 'story'. if you will enable all of them - you will get the full story of the mail vector with multiple stages of protection in different layers (Network/File protection(IPS) -> known Hashs(Anti-Virus) ->Zero-Day attacks(Threat Emulation)
if you dont have all of them enabled in your network - i can advice you to talk to your SE and enable them for a short period of time.....in this way you will be able to see the full value of the product + already divided to attack vectors.
if you want to share with me the results you have now and discuss them for better understanding the attack flows against your network - you are welcome to send me an email (+add your SE as a CC)
Thanks,
Oren
- Mark as New
- Bookmark
- Subscribe
- Mute
- Subscribe to RSS Feed
- Permalink
- Report Inappropriate Content
Awesome. Thank you for sharing
- Mark as New
- Bookmark
- Subscribe
- Mute
- Subscribe to RSS Feed
- Permalink
- Report Inappropriate Content
Nice Dashboard. I have imported template in my LAB. Nice look.
- Mark as New
- Bookmark
- Subscribe
- Mute
- Subscribe to RSS Feed
- Permalink
- Report Inappropriate Content
Thanks,
if you have any insights/changes you think we should do - please contact me.
- Mark as New
- Bookmark
- Subscribe
- Mute
- Subscribe to RSS Feed
- Permalink
- Report Inappropriate Content
Very good !!!
- Mark as New
- Bookmark
- Subscribe
- Mute
- Subscribe to RSS Feed
- Permalink
- Report Inappropriate Content
Oren,
Thank you for sharing!
One thing I would like to note is that the text in some of the grid-based widgets is obstructed:
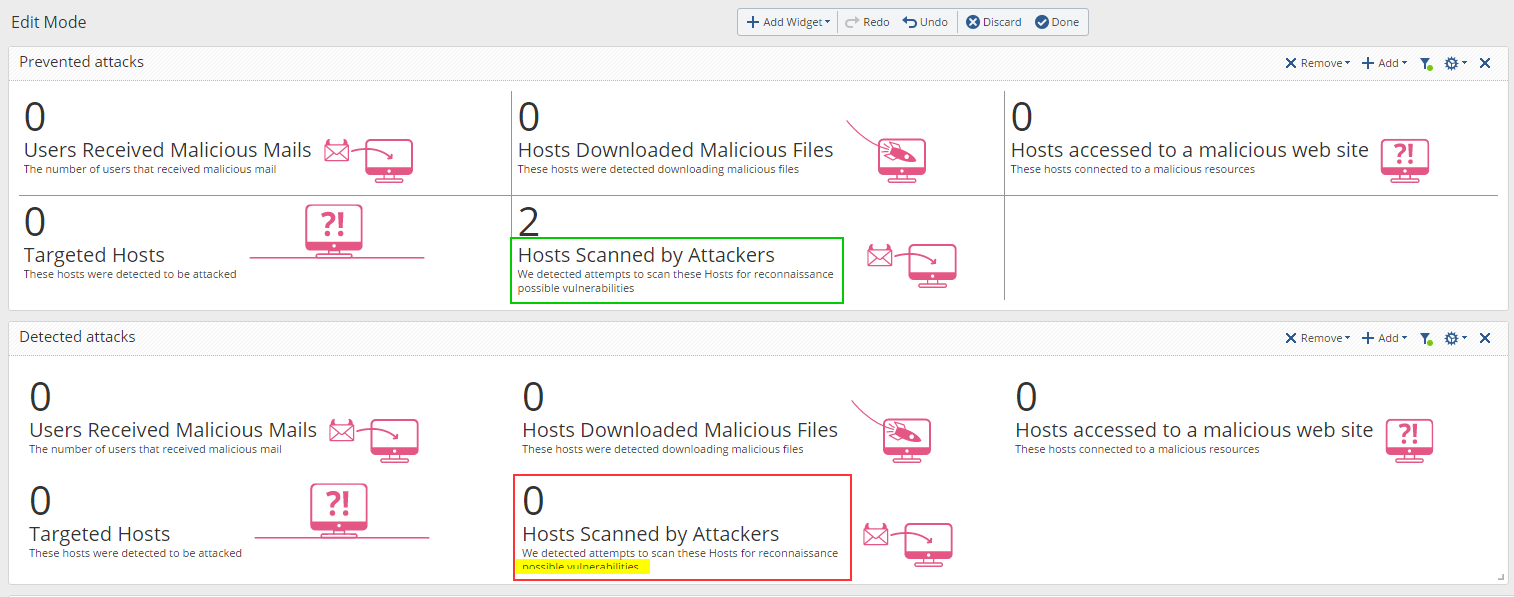
When you go into editing mode and display grid lines, the text is shown properly, as it is in the green frame.
However, in normal view, the bottom line is only partially shown, as depicted in the red frame highlighted section.
I do not see the means of adjusting the frames to accommodate the text properly.
I am not sure if it's simply my inability to find the right setting or a minor bug, but would appreciate you looking into it.
Thank you again,
Vladimir
- Mark as New
- Bookmark
- Subscribe
- Mute
- Subscribe to RSS Feed
- Permalink
- Report Inappropriate Content
Hey,
i will look into it.
the simple solution is to use a different template for the text box.
i am working on the next release for Check Mates and i think it will be possible to fix it for it.
will post a new version in few days and it will be great if you could test it.
Thanks,
Oren
- Mark as New
- Bookmark
- Subscribe
- Mute
- Subscribe to RSS Feed
- Permalink
- Report Inappropriate Content
It'll be my pleasure.
- Mark as New
- Bookmark
- Subscribe
- Mute
- Subscribe to RSS Feed
- Permalink
- Report Inappropriate Content
Much thanks! The main dashboard runs fine for me but none of the CKC views will not produce any results. Do you have any idea why that is or a way for me to make them work?
- Mark as New
- Bookmark
- Subscribe
- Mute
- Subscribe to RSS Feed
- Permalink
- Report Inappropriate Content
ofcorse.
if you could share screenshots it can help me to understand better and have a solution for it.
if you prefer a short zoom session so i will fix it specifically for you and add the fix to the Check-Mates release of next week it can be great also.
- Mark as New
- Bookmark
- Subscribe
- Mute
- Subscribe to RSS Feed
- Permalink
- Report Inappropriate Content
I'm open for a Zoom session. I'll email you shortly.
- Mark as New
- Bookmark
- Subscribe
- Mute
- Subscribe to RSS Feed
- Permalink
- Report Inappropriate Content
More business questions from the community
Hey all,
for the next-next version (not the one i will release next week) i am looking for more dashboards you would like to have for threat prevention events.
i am interested to understand what are the interesting questions you want to have an answer for. (like 'how many malicious mails was sent to my network' OR 'how many RECON attempts i had on my network')
i got lots of mails, inputs and zoom sessions from the community and based on your inputs, upgraded the threat dashboard for R80.10 & R80.20 upcoming release.
please keep sending me your inputs and if there is a need for a zoom session and dedicated investigation on your logs, please send me the need and we will coordinate time for it.
Thanks,
Oren
- Mark as New
- Bookmark
- Subscribe
- Mute
- Subscribe to RSS Feed
- Permalink
- Report Inappropriate Content
1.2 Version
the original attached file in the post was updated
Hey all,
as promised, based on your inputs & zoom sessions, i updated the threat dashboard:
- Queries optimize
- Text alignments
- Colors changes for better understanding
- clean icons (we are preparing the new icons for the dashboard in this days)
- better order of the different views
please keep send me your inputs.
Thanks,
Oren
- Mark as New
- Bookmark
- Subscribe
- Mute
- Subscribe to RSS Feed
- Permalink
- Report Inappropriate Content
Hi Oren,
Thanks for the Update. It is really nice to have such dashboard where we can easily see important activities.
- Mark as New
- Bookmark
- Subscribe
- Mute
- Subscribe to RSS Feed
- Permalink
- Report Inappropriate Content
Looks much cleaner and easier on the eyes.
Thank you for continued efforts to get it refined and published so fast!
- Mark as New
- Bookmark
- Subscribe
- Mute
- Subscribe to RSS Feed
- Permalink
- Report Inappropriate Content
Hey,
Thanks for the feedback! ![]()
please keep sending me improvements for the threat dashboard, your inputs are very important for us!
already working on the next version update.
- Mark as New
- Bookmark
- Subscribe
- Mute
- Subscribe to RSS Feed
- Permalink
- Report Inappropriate Content
Nice one !
- Mark as New
- Bookmark
- Subscribe
- Mute
- Subscribe to RSS Feed
- Permalink
- Report Inappropriate Content
Hi Oren,
I am looking for URL Filtering - specific user report. I have tried to make custom user report but not able to pull all the data. Also it takes lot of time to go with all the TAB and see how it looks.
Please let me know if you have any template for such report.
- Mark as New
- Bookmark
- Subscribe
- Mute
- Subscribe to RSS Feed
- Permalink
- Report Inappropriate Content
Excellent template , most useful. Thanks a lot for saving my time...
- Mark as New
- Bookmark
- Subscribe
- Mute
- Subscribe to RSS Feed
- Permalink
- Report Inappropriate Content
Hi Gaurav,
if you can be more specific on what you want to see in the report/view - i can try to help.
- Mark as New
- Bookmark
- Subscribe
- Mute
- Subscribe to RSS Feed
- Permalink
- Report Inappropriate Content
Hey Vladimir,
Thanks for the input.
after taking it with the UX team (to discuss the way of presentation in R80.20), one of the inputs was to present the text as hover and delete all the small lines of texts from the main page. in the next few days i will upload a newer version with hovers that i think you would like.
regard the align of the grid - will take it internally to verify that this is the behavioral we wanted to achieve...
Thanks again for your inputs!
Oren
- Mark as New
- Bookmark
- Subscribe
- Mute
- Subscribe to RSS Feed
- Permalink
- Report Inappropriate Content
Hi Oren,
Do you have any plans for implementing icons that represents all the different types of icons the R80.10 uses?
For example using the icon for detect  and possibility to one owns icons?
Thanks
Best Regards
Kim
Kim
- Mark as New
- Bookmark
- Subscribe
- Mute
- Subscribe to RSS Feed
- Permalink
- Report Inappropriate Content
Hi Oren,
After number of R&D, I succeed to produce report for one specific user. I have included below parameters.
Web Categories accessed by User
URL accessed by User
Browse Time
Time stamp
Suspicious activity by user
Number of blades used by User
However if you have any template, you can share so that I can explore more.
- Mark as New
- Bookmark
- Subscribe
- Mute
- Subscribe to RSS Feed
- Permalink
- Report Inappropriate Content
Hey Kim,
ofcorse! we already created the relevant icons.
will check if will be relevant only for R80.20 or also for R80.10
Thanks,
Oren
- Mark as New
- Bookmark
- Subscribe
- Mute
- Subscribe to RSS Feed
- Permalink
- Report Inappropriate Content
Hey Oren,
I will be looking forward to see the result in R80.20.
Also it would be nice to upload your own icons with three different pixel sized.
Thanks
Kim
Best Regards
Kim
Kim
- Mark as New
- Bookmark
- Subscribe
- Mute
- Subscribe to RSS Feed
- Permalink
- Report Inappropriate Content
Hey Kim,
i think its a very good RFE.
just remember that uploading an external file is always risky (you are using it today in mobile access, i know) and you are the uploader BUT because of the security risk, the development of this kind of feature will not be extremely short.
Thanks,
Oren
Leaderboard
Epsum factorial non deposit quid pro quo hic escorol.
| User | Count |
|---|---|
| 6 | |
| 4 | |
| 3 | |
| 2 | |
| 2 | |
| 2 | |
| 2 | |
| 2 | |
| 1 | |
| 1 |
Upcoming Events
Thu 02 May 2024 @ 10:00 AM (CEST)
CheckMates Live BeLux: How Can Check Point AI Copilot Assist You?Thu 02 May 2024 @ 04:00 PM (CEST)
CheckMates Live DACH - Keine Kompromisse - Sicheres SD-WANAbout CheckMates
Learn Check Point
Advanced Learning
YOU DESERVE THE BEST SECURITY
©1994-2024 Check Point Software Technologies Ltd. All rights reserved.
Copyright
Privacy Policy
Facts at a Glance
User Center